I am trying to plot a graph with Months on the X-axis and some value on the Y-axis. The months on the X-axis start from January and end in December. I want them to start on May and end at April. How do I do this?
 plot_ly(data = fdata, type = "scatter", mode = "markers+lines",
            x = ~months, y = ~Total, color = ~Years.Since.Initiation,height = "100%") %>%
      layout(xaxis = xx, yaxis = yy)})
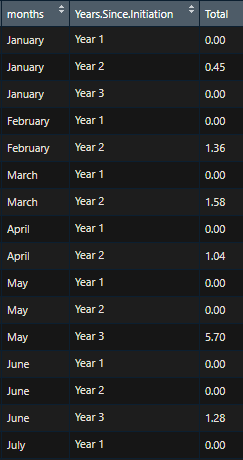
This is a small part of the dataset. The months column is a factor
You have to specify the order of the levels for the factor, otherwise, it gets ordered alphabetically. See this example:
months <- c("January", "February", "March", "April")
as.factor(months)
#> [1] January  February March    April
#> Levels: April February January March
factor(months, levels = c("January", "February", "March", "April"))
#> [1] January  February March    April
#> Levels: January February March April
Created on 2020-03-24 by the reprex package (v0.3.0.9001)
Hey! I actually did specify the order of levels. I just didn't attach that code. My months arrange like your second example (January, February.... December) the question remains how can I make them start from May when I make the plot instead of January?
To help us help you, could you please prepare a reproducible example (reprex) illustrating your issue? Please have a look at this guide, to see how to create one: