Dear Posit Community,
Hi there!
For my thesis I had to make a regression using plm package using random effects, and adjusting for heteroskedasticity-consistent (HC) standard errors. I'm very new at statistical concepts so my questions may be very "strange" but I really need help...
The thing is, when I try to use the stargazer package to retrieve the results I'm not able to have the same results that I have using the summary with the HC standard errors. That is...
-
The code I'm using for summary is and the output (1):
summary(roa_model, vcov = function(x) vcovHC(x, method="arellano", type="HC1", cluster = "group")) -
The code I'm using for stargazer is and the output (2):
stargazer(roa_model, se=list(vcov(roa_model)), type= "text")
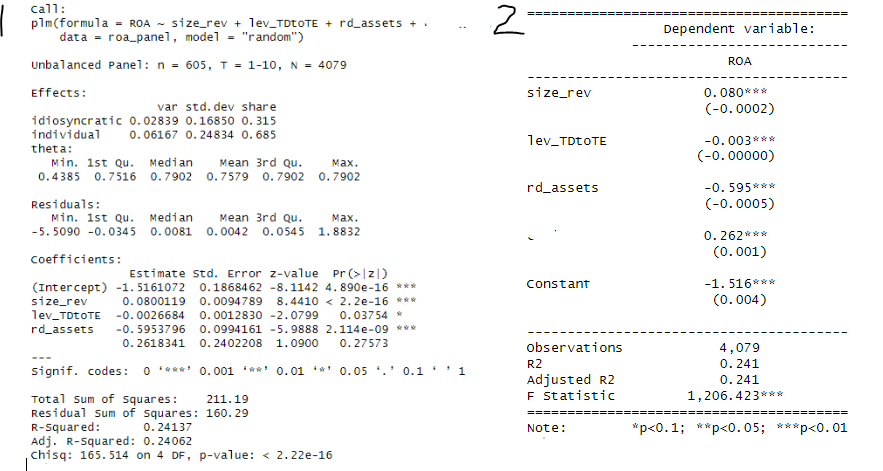
As you can see the values of estimates, coefficients of determination and number of observations are ok. But then:
- the standard errors values are different,
- the p-values also seem odd (e.g., pvalue of lev_TDtoTE is 0,04 so it should be presented with 2 stars on the second image (stargazer output) but somehow it is presented with 3 stars), and finally,
- the stargazer output depicts a f-statistic while the summary the chi square. Is this normal? Can f-statistic be used for models using random effects?
Shouldn't it produce the same results? What am I doing wrong to have such strange differences, and how can I fix it?
On another note, I have saw in one paper a table from a plm using random effects were they described the mean vif's. Is this the mean of each absolute vif output for each variable? So for instance, to present this in my study, and taking into account that in each regression I have 4 independent variables, should i do the average of the resulting 4 vifs to present in the table?
Can someone help me understand these points please? I really need some help and would highly appreciate it!
Thanks in advance!
Yours sincerely,
Carol