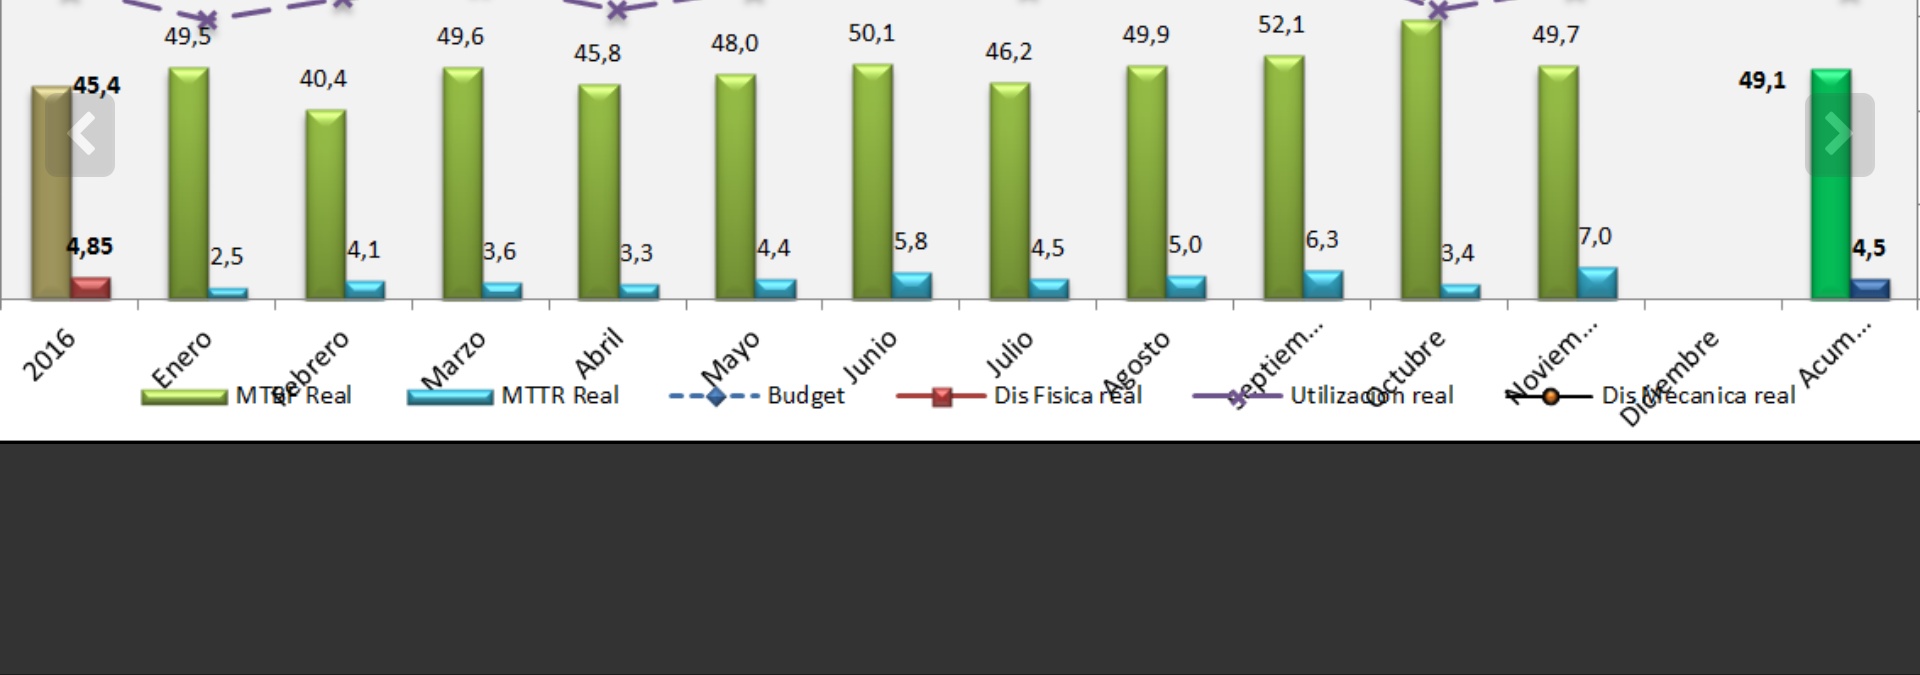
Hi all, I'm new to rscript, is it possible to have chart like this?
Yes, you can do it using ggplot2
If you need more specific help, please provide a proper REPRoducible EXample (reprex) illustrating your issue.
This topic was automatically closed 21 days after the last reply. New replies are no longer allowed.