I have two vectors:
A <- c(91, 4, 3, 2)
B <- c(80, 5, 5,10)
The numbers in the vectors correspond to the 4 different categories.
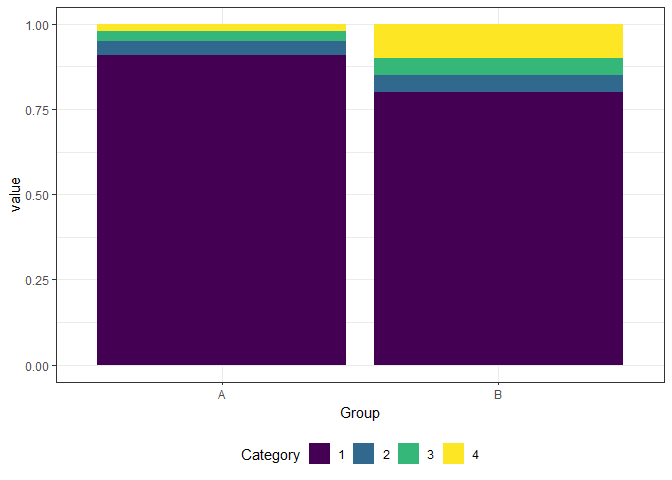
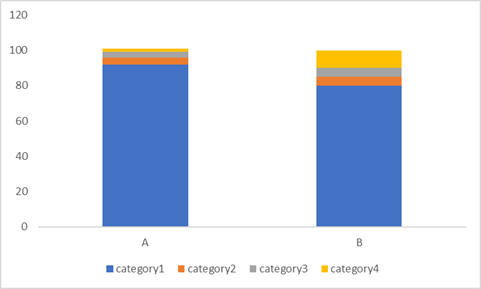
I would like to create a stacked plot in R like shown in the image here. how should I do that?
I have two vectors:
A <- c(91, 4, 3, 2)
B <- c(80, 5, 5,10)
The numbers in the vectors correspond to the 4 different categories.
I would like to create a stacked plot in R like shown in the image here. how should I do that?
This should get you started and then you subsequently customize to your likings
library("tidyverse")
d = tibble(A = c(91, 4, 3, 2),
           B = c(80, 5, 5,10),
           Category = factor(seq(1, 4)))
d %>%
  gather(Group, value, -Category) %>%
  ggplot(aes(x = Group, y = value, fill = Category)) +
  geom_col() +
  theme_bw() +
  theme(legend.position = "bottom")
Slight suggested amendment to @Leon's solution:
Change the geom_col() call to
geom_col(position = position_fill(reverse = TRUE))
This positions the stacked bars in a more logical order than the default.
Thank you @Leon and @martin.R I tried the above commands, but I am getting issue with the ordering.
I would like the values of category 1 (i.e numbers 91 and 80 in vectors A & B) to be filled up first, followed by second category numbers (4 and 5 in vectors A & B respectively) and so on.
Thank you!
That's what @martin.R suggestion does ![]()
@Leon.
No, it just reversed the order of filling the category values (Category2 > Category1 > Category3 > Category4) which were plotted according to your command. It didn't produce the exact order that's shown in the image (Category1 > Category2 > Category3 > Category4).
I got the desired output from posted code above
d %>%
  gather(Group, value, -Category) %>%
  ggplot(aes(x = Group, y = value, fill = Category)) +
  geom_col(position = position_fill(reverse = TRUE)) +
  scale_fill_viridis_d() +
  theme_bw() +
  theme(legend.position = "bottom")