Hello,
I have a problem in R with my stacked ggplot. I add error bars (see the code above) but it seems that certain error bars are not properly positioned, i can't find an issue with that.
p <- ggplot(homme_N, aes(x=phoneme, y=score, fill=flow)) + geom_bar(stat = "identity", width = 0.3)+ scale_y_continuous(name = "Débit d'air (l/s)")+ scale_fill_discrete(name = "Débit d'air") + geom_errorbar(aes(ymin = score-sd, ymax = score+sd, group = flow), width=0.2)
p + theme(axis.text.x = element_blank())
p + facet_grid(col=vars(masque))
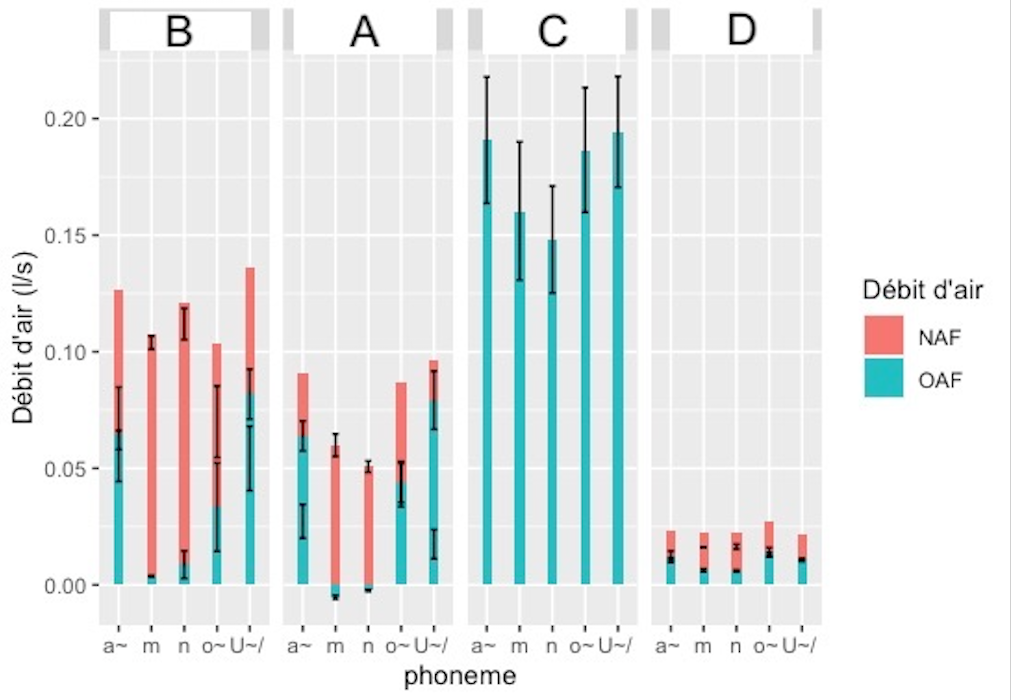
and the data frame ![]()
masque,sexe,phoneme,flow,score,sd
A,homme,a~ ,NAF,0.027297745000000002,0.00722273
A,homme,a~ ,OAF,0.063903964,0.006419403
A,homme,m,NAF,0.059978595,0.004831463
A,homme,m,OAF,-0.005211909,8.17413e-4
A,homme,n,NAF,0.050739343,0.002428541
A,homme,n,OAF,-0.002361964,3.96173e-4
A,homme,o~ ,NAF,0.042832804,0.009332614
A,homme,o~ ,OAF,0.044248627,0.008789779
A,homme,U~/ ,NAF,0.01746766,0.006268549
A,homme,U~/ ,OAF,0.079212114,0.012503058
B,homme,a~ ,NAF,0.06214825,0.004056089
B,homme,a~ ,OAF,0.064619105,0.020246194
B,homme,m,NAF,0.103927853,0.002866807
B,homme,m,OAF,0.003750411,2.63424e-4
B,homme,n,NAF,0.111916352,0.006691687
B,homme,n,OAF,0.008740466,0.00590368
B,homme,o~ ,NAF,0.06998429,0.015341479
B,homme,o~ ,OAF,0.033371557,0.018984569
B,homme,U~/ ,NAF,0.054255909,0.013840777
B,homme,U~/ ,OAF,0.081830606,0.010699558
C,homme,a~ ,OAF,0.190726388,0.027090532
C,homme,m,OAF,0.160358461,0.029618615
C,homme,n,OAF,0.148125749,0.022906967
C,homme,o~ ,OAF,0.18649138,0.026763486
C,homme,U~/ ,OAF,0.194289376,0.023746858
D,homme,a~ ,NAF,0.010611618,0.001042756
D,homme,a~ ,OAF,0.012565542,0.002020356
D,homme,m,NAF,0.016145107,1.8767e-4
D,homme,m,OAF,0.006288278,6.76678e-4
D,homme,n,NAF,0.016433325,0.001019347
D,homme,n,OAF,0.005972245,4.27756e-4
D,homme,o~ ,NAF,0.012910139,9.59323e-4
D,homme,o~ ,OAF,0.014111029,0.001856333
D,homme,U~/ ,NAF,0.010266921,1.70229e-4
D,homme,U~/ ,OAF,0.011186092,8.47e-5
thank you in advance for your help,
Amélie