how do I read this stacked density plot.
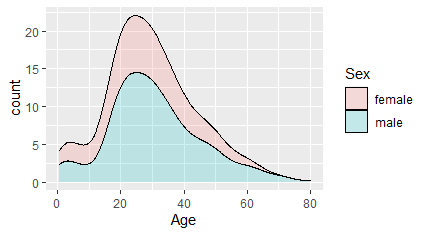
The one plotted above the other, does it also start from the axes or its values start from above the one plotted below it.
how do I read this stacked density plot.
The one plotted above the other, does it also start from the axes or its values start from above the one plotted below it.
Hi,
I think you have an area plot rather than a density plot (which plots the distribution summed to 1). Area plots usually stack on top of each (so add values onto the series below rather than zero on the y-axis). Do you have the code then we can see?
Hi Joe,
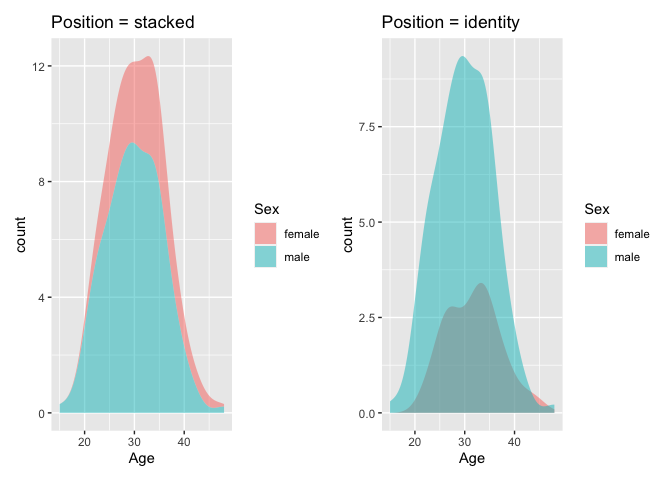
It makes things easier if there's a reproducible example (reprex) to work with including code and data, but here's a toy example of the same data plotted with position = "stacked" and position = "identity". In your figure, I would read that the values start from the one plotted below it, and you have approximately 3x's as many males in your dataset as females, both with a modal age around 25.
library("tibble")
library("ggplot2")
library("patchwork")

set.seed(456)
DF <- tibble(Sex = c(rep("female", 50), rep("male", 150)),
  Age = rpois(200, 30))

# Position is stacked on each other
p_stacked <- ggplot(DF) +
  stat_density(aes(x = Age, y = ..count..,
    fill = Sex), position = "stack", alpha = 0.5) +
  labs(title = "Position = stacked")

# Position starts from the axes
p_identity <- ggplot(DF) +
  stat_density(aes(x = Age, y = ..count..,
    fill = Sex), position = "identity", alpha = 0.5) +
  labs(title = "Position = identity")


p_stacked + p_identity
Created on 2020-08-30 by the reprex package (v0.3.0)
wow, that helped. But in my example, there were two modes, one at the age of 5 and other at 25.
This topic was automatically closed 21 days after the last reply. New replies are no longer allowed.
If you have a query related to it or one of the replies, start a new topic and refer back with a link.