Hi! I want to do a 100% Stacked Barchart in Rstudio, but I'm not succeeding. I want a total of 6 stacked bar charts in three time points, so two for each timepoint. I have already calculated the relative amounts of the each variable. Here is my code with the data:
Create a data frame from your dataset
data <- data.frame(
Time_point = c(3, 4, 5),
FucOS_HM = c(64.5620537, 69.3131451, 72.7929582),
NeutralOS_HM = c(29.6730857, 25.9042445, 22.9723581),
SiaOS_HM = c(5.76486057, 4.78261038, 4.23468375),
FucOS_F = c(70.1396276, 72.701452, 73.1641288),
NeutralOS_F = c(20.9520774, 19.6301567, 20.0541627),
SiaOS_F = c(8.908295, 7.66839125, 6.78170848)
)
Reshape the data from wide to long format
data_long <- melt(data, id.vars = "Time_point")
Create a new column to identify the type (_HM or _F)
data_long$type <- sub("_.*", "", data_long$variable)
Create the stacked bar plot
ggplot(data_long, aes(x = Time_point, y = value, fill = variable)) +
geom_bar(stat = "identity", position = "fill") +
scale_fill_manual(values = c("#FF0000", "#00FF00", "#0000FF", "#FF00FF", "#00FFFF", "#FFFF00")) +
labs(x = "Time Point", y = "Percentage", fill = "Component") +
theme_bw()
This is the graph that is giving me:
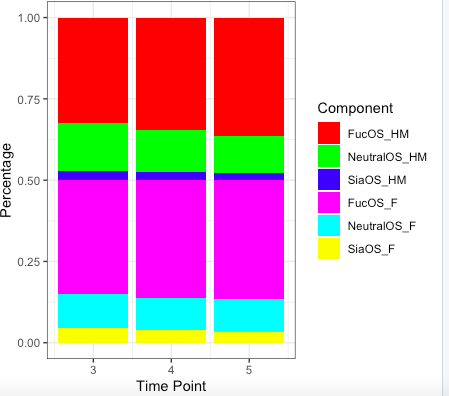
I would really appreciated if someone could tell me how to specifically tell R how to do 6 stacked bars, _HM besides _F for each time point.
Thank you so much!