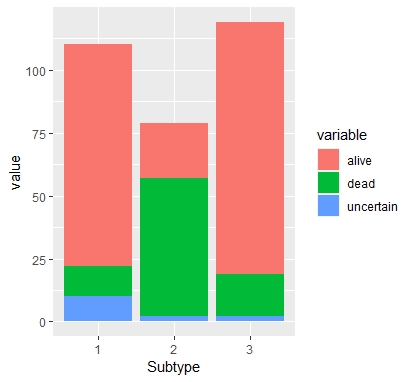
my dataframe
tata4 <- data.frame(Subtype = c("Prostate", "Oesophagus", "Lung"),
alive = c(88, 22, 100), dead = c(12, 55, 17), uncertain = c(10, 2, 2), total = c(186,46,202))
what I want is this - A stacked barplot for each of the 'prostate', 'oesophagus and Lung. The columns should be subdivided vertically into the number alive,dead and uncertain according to each cancer. (with each bar displaying the total).
I'm struggling to find the right codes. I can't seem to find a way of making the 'fill' function the values of each tumour site.
Can someone please help.


