Split numeric data based on Index range.

library(data.table)
data1 <- fread(file.choose(), nrows=18, fill=T, sep="=")
data2 <- fread(file.choose(), skip=21) #read data from [specdata0]
stopRow <- which(data2$V1 %like% "finish") #find line "finish"
data3 <- data2[c(1:(stopRow-1))] #keeps only lines between specdata and finish
data3 = as.numeric(data3$V1)

I changed the data type as I initially the data was of "list" and I couldn't perform any statistical calculations on that.

Now I want to divide this 27K data into 3 group of 9000 data points each.

later I want to divide first 9000 data sets into n number of sets.

How can I do this in R ? Please find the attached picture (picture of data set)

Capture

My data is just of 1 column.

Hi,

Welcome to the RStudio community!

I hope I understood your question well as here is a way I would solve this:

library(dplyr)

#Some random data
myData = data.frame(x = runif(27000))

#Create the groups
myData$split1 = sort(rep(1:3, 9000))

#Split the data (base R)
data1 = myData[myData$split1 == 1,]

#Split the data (Tidyverse)
data1 = myData %>% filter(split1 == 1)

head(data1)
           x split1
1 0.64507888      1
2 0.71108489      1
3 0.90753440      1
4 0.01510235      1
5 0.88911024      1
6 0.77891414      1

You can repeat the procedure for subdivisions

Hope this helps,
PJ

1 Like

Hey Pj,

Here when we use "sort" command dose it rearrange the data and than split them into 3 sets ?
I mean sorting in ascending or descending. Because I don't want data to be sorted before splitting.

Thank You,

BR
Shri

Hi,

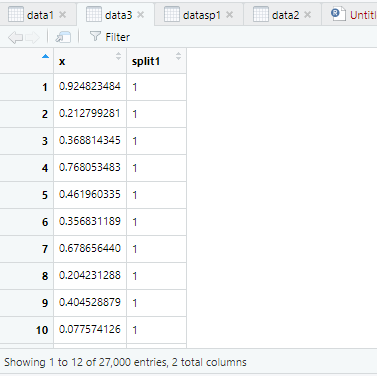
No the sort is before we assign the column. It just ensures that we have first 9000 1, then 9000 2, ... as the rep function generates a list of 1,2,3,1,2,3,1,2,3,... so I sort it into first all 1 then 2 then 3

Look at this example:

myData = data.frame(x = 1:9)
myData$split1 = sort(rep(1:3, 3))
myData
  x split1
1 1      1
2 2      1
3 3      1
4 4      2
5 5      2
6 6      2
7 7      3
8 8      3
9 9      3

PJ

Hi,

You probably don't need it, but since I was thinking that the previous method would only work if indeed the data could be evenly split into the exact number of groups, I created a little function that lets you assign groups to data, even if you can't split it perfectly

createGroups = function(nData, nGroups){
  
  groups = rep(1:nGroups, floor(nData / nGroups))
  
  if(nData %% nGroups != 0){
    groups = c(groups, 1:(nData %% nGroups))
  }

  sort(groups)
  
}

createGroups(18, 4)
1 1 1 1 1 2 2 2 2 2 3 3 3 3 4 4 4 4

In the example, if you like to split 18 rows in 4 groups, the best way is in two groups of 5 rows and 2 of 4. If the split can be done perfectly, it does of course.

Hi Pj,

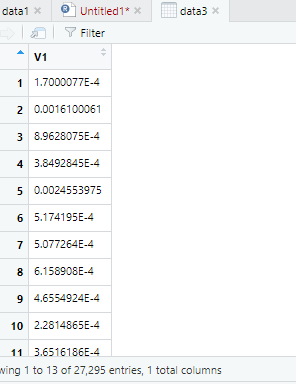
I followed the code which you suggested definitely it works, but I see that my initial data and data values after dividing them into 3 sets aren't same. Please check my previous picture and present picture after dividing them into 3. Capture-2

Data values changed in column.

Thank You,
Shri

Hi,

I thought of using them as well, but the split function requires a factor to split on, and in this case there is none, only a list of values to split. Unless I'm missing something here then please correct me :slight_smile:

PJ

1 Like

Hi @Yarnabrina ,
Thank you for your input.

my data set - it has 27295 readings.

1.7000077E-4
0.0016100061
8.9628075E-4
3.8492845E-4
0.0024553975
5.174195E-4
5.077264E-4
6.158908E-4
4.6554924E-4
2.2814865E-4
3.6516186E-4
1.8762914E-4
1.9749609E-4
5.9608085E-4
2.9951334E-4
0.0012863975
1.3196035E-4
8.8556146E-5
1.105725E-4
8.976176E-5 ..... continues

for statistical analysis I need readings of first 15000.

Thank You
Shri

Hi,

Oh I get it now! Indeed it's much better to split the data-frame with a function. I was just focusing on the column with the split indices. Also, I did not know the rep's 'each' argument! :slight_smile:

Anyway I think @Shri1506 got enough code now to solve the issue :slight_smile:

PJ

1 Like

This topic was automatically closed 7 days after the last reply. New replies are no longer allowed.