ggplot2 - Spider / radar chart with multiple scales on multiple axes using R -
I've this df :
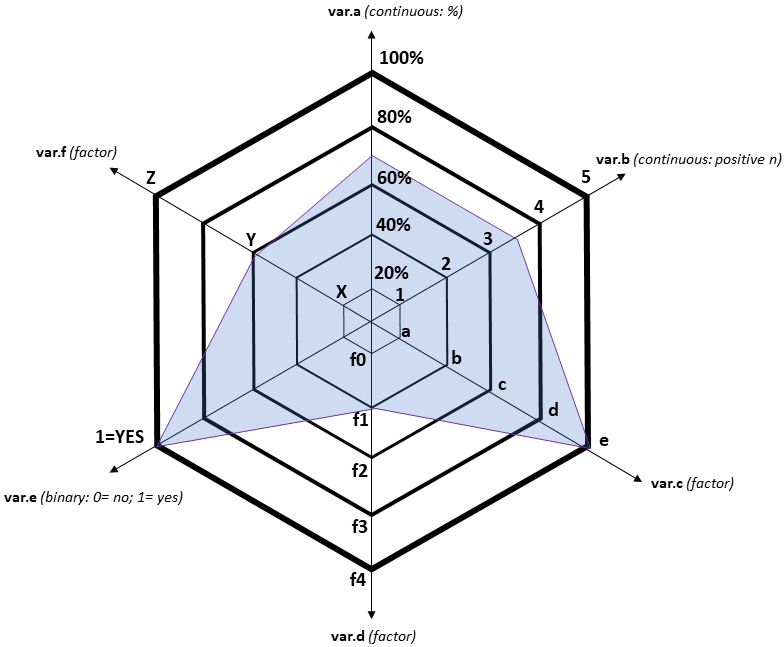
df<- data.frame ("var.a" = .7,
"var.b" =  3.5,
"var.c" = as.factor("e"),
"var.d" = as.factor("f1"),
"var.e" = as.integer(1),
"var.f" = as.factor("y") )
I would like to produce a radar (spider) chart like the picture added. Is there any way to produce this chart through R?