For the ACF function, the argument you're trying to use is called maxLag. The code your provided in the link is plot(ACF(tim2, maxlag = 10), alpha = 0.01). R is case sensitive, and therefore maxlag is not an argument to the ACF function and doesn't do anything to change the plot. If you switch to maxLag, the function should work as desired.
Also, for future reference, it will be easier to help you if you create a small self-contained example of your problem (known as a reproducible example or reprex) that can be pasted directly into your question, using either a small subset of your data or a built-in data set. (See here for detailed information on how to do this.) Here's an example using the built-in mtcars data frame:
library(Matrix)
library(nlme)

m1 = lme(mpg ~ wt + hp, random=~1|carb, data=mtcars)

# Default maxLag
plot(ACF(m1))
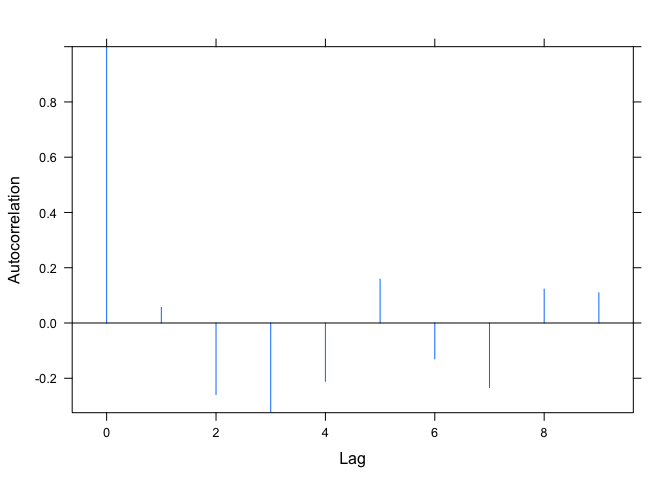
# Argument is spelled incorrectly and has no effect on the plot
plot(ACF(m1, maxlag=4))
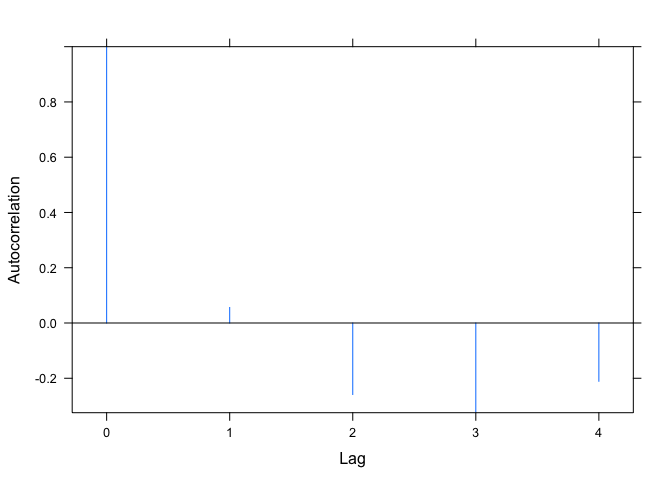
# Argument is spelled correctly
plot(ACF(m1, maxLag=4))
Created on 2018-12-09 by the reprex package (v0.2.1)