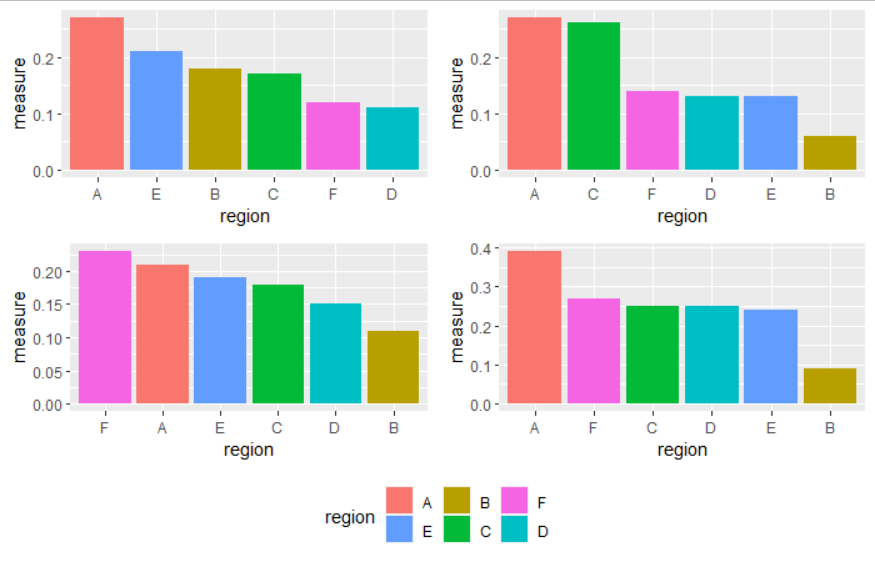
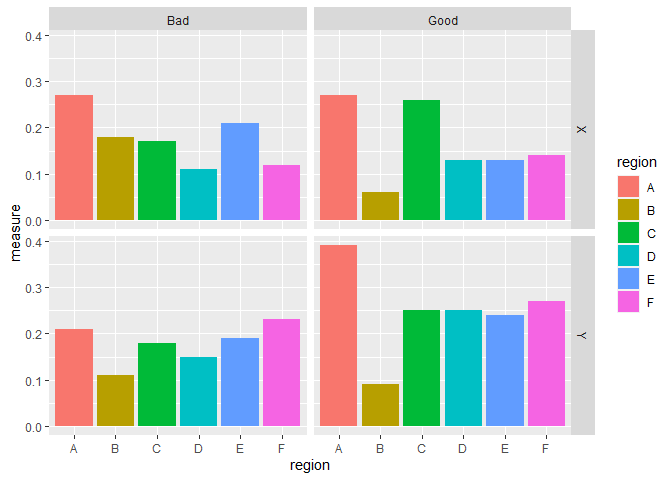
In the following plot, how do I obtain sorted bar across all facet? That is, region will be sorted according to measure values in all grids.
suppressWarnings(suppressMessages(library(tidyverse)))
# Data
m <- c(0.27, 0.27, 0.39, 0.21, 0.06, 0.18, 0.09, 0.11, 0.26, 0.17,
       0.25, 0.18, 0.13, 0.11, 0.25, 0.15, 0.13, 0.21, 0.24, 0.19, 0.14,
       0.12, 0.27, 0.23)
toy_df <- tibble(
  region = rep(c("A", "B", "C", "D", "E", "F"), each = 4),
  type = rep(c("X", "Y"), each = 2, times = 6),
  fact = rep(c("Good", "Bad"), times = 12),
  measure = m
)
# Plot
toy_df %>%
  ggplot(aes(x = region, y = measure, fill = region)) +
  geom_bar(stat = "identity") +
  facet_grid(`type` ~ `fact`)
Created on 2020-10-19 by the reprex package (v0.3.0)