socioeconomic index - geoShiny (Argentina)
Authors: Camila Higa, Juan Pablo Pilorget, Juan Pablo Ruiz Nicolini
Working with Shiny more than 1 year
Abstract: The Socioeconomic Index App is a tool that aims to facilitate the analysis of the socioeconomic characteristics of Argentina's population.
Full Description: The Socioeconomic Index App is a tool that aims to facilitate the analysis of the socioeconomic characteristics of the population. This serves as an input for the design and impact evaluation of public policy. Also, based on the premise that there is an association between socioeconomic level and electoral behavior, it may be helpful for electoral analysis and strategies. In a few words, the main purpose of the tool is to carry out more precise and exhaustive diagnoses that serve to a better understanding of how politics works and how to design public policy.
Based on disaggregated data from the 2010 National Census (INDEC, 2012) we elaborated an index that summarizes a large volume of information in a census radius level for the entire territory of Argentina.
The final database we worked with consisted of 52,272 observations (census radius – the smallest unit of territory in which the country is distributed) that grouped information from more than 12 million households (hhs) and more than 41.4 million registered people. With this data, we performed a Principal Component Analysis (PCA) to reduce dimensionality.
We used structural variables (such as the housing conditions) and social variables (such as the highest degree reached by the householder):
- % of hhs with employed householder;
- % of hhs with at least one Unmet Basic Needs (NBI);
- % of women;
- % of hhs with a householder who has at least a high school degree;
- % of hhs with poor housing conditions;
- Mean age;
- Median age.
PCA statistical technique consists of obtaining as much information as possible from a data set by constructing latent variables from the existing variables in which correlations are observed and reducing the dimensionality of the phenomenon. The components are linear combinations of the original variables and only a few are expected to collect most of the variability of the data.
The PCA results from the selected data show that approximately 67% of the variability can be explained by the first two components. With them, we were able to obtain two indices (main and secondary) where we can explore distinctive socioeconomic characteristics of the population for each census radio in all districts within each of Argentina's 24 provinces. High values of the index represent better socioeconomic conditions and low values the opposite.
The main index explains almost half of the total variability (47%) of the data set and describes, in a single variable, the socioeconomic characteristics of the population for each census radius. High scores in the radius are those with a low percentage of households with at least one Unmet Basi Need (NBI in Spanish) and houses with poor housing conditions. Similarly they householders who have at least a high school degree and higher average age and women proportion. This is also consistent with smaller average-sized households.
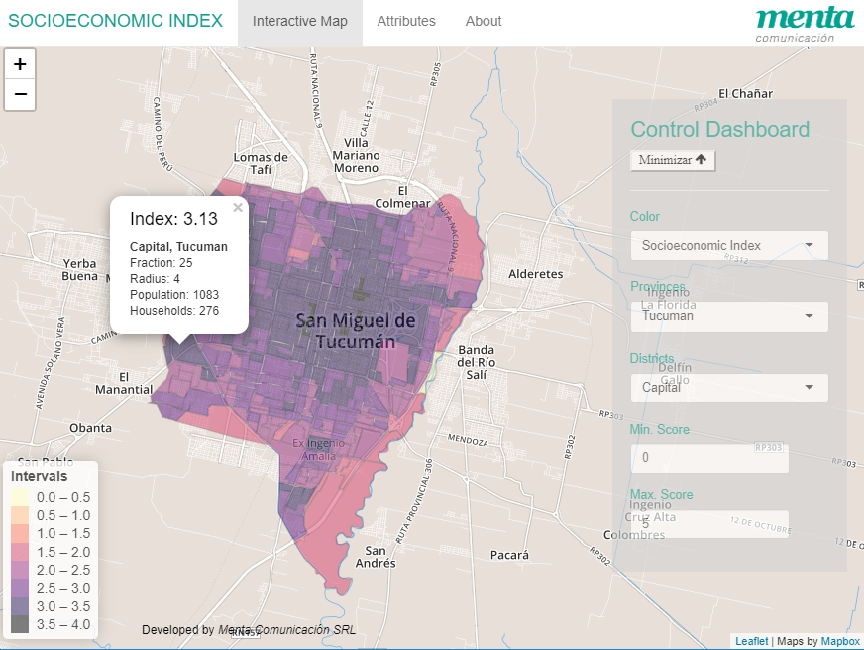
The application starts with a display of an Argentina map and a drop-down menu that allows you to select the territory to be analyzed, first selecting a province and then a district. The cartographic division within each of the districts is the census radius.
In the lower-left corner, the range of observed values of the Socioeconomic Index in that territory is plotted (from a possible range that varies between a minimum of 0 and a maximum of 5). The ranges are related to a color palette with which the census radius is filled.
The map also makes it possible to display a popup with summary information about the selected census radius. These are unique identifiers (fraction and census radius, according to the INDEC nomenclator) and the number of registered population and households.
Another useful element is found in the filters of the Index (at the bottom end of the drop-down menu). There we can set values within the range that is printed when selecting each district and the result will be to present the only radius that meets the condition.
Finally, the application also allows you to explore the indicators from a table with all the observations for the entire country, with the additional possibility of filtering by certain values of interest.
Category: Research
Keywords: gis, data_viz, socioeconomic, spatial, leaflet
Shiny app: https://mentacomunicacion.shinyapps.io/socioeconomic_app/
Repo: GitHub - mentaComunicacion/socioeconomic_app: 👉App to visualize the characteristics of the population in Argentina
RStudio Cloud: Posit Cloud
Thumbnail:
Full image: