SMPS banana plot

Hi,
I am trying to make the SMPA banana plot using GitHub - benmarwick/smps: time series colour contour plots of data from Scanning Mobility Particle Sizer (SMPS) data
But, I'm not able to do that. I am getting the following error:

Please provide some information on how to make the plot like:

I know nothing about the package but it looks like you have a serious multicolinearity problem in the data.

Try this and I think you will see what I mean.

dat1  <- read.csv("sample_smps_numbers.csv")
dat2  <- dat1[, 2:11]
cor(dat2, method = "pearson", use = "complete.obs")

I take back my earlier remark about mulitcolinearity, at least for the moment.

There seems to be something seriously wrong with the .csv file. It has 26685 rows of data. Of these, 7326 rows have data. The other 19359 rows consist of nothing but commas which gives us 19359 rows of NA's.

There also seems something strange about row1 The first column has a variable name' Time. The succeeding 106 columns have numbers. Is this intended?

Thanks for spending time on my query.

As you mentioned "The succeeding 106 columns have numbers" --> these number represents the particle size range. It should be like this.

"The other 19359 rows consist of nothing but commas which gives us 19359 rows of NA's." --> 0 and NA can be replaced with a blank.

The data in the example also have removed 0 with blanks " GitHub - benmarwick/smps: time series colour contour plots of data from Scanning Mobility Particle Sizer (SMPS) data"

prepare_data(smps_data)
Error in can_take_these_rows$starts[i]:can_take_these_rows$ends[i] :
NA/NaN argument

(How can I fit this error in my data set? Pls help me.)

Hi Zwe, welcome to the forum.

You will likely get better help if you start a new question.

See FAQ Asking Questions for some suggestions on how to do this

A handy way to supply some sample data is the dput() function. In the case of a large dataset something like dput(head(mydata, 100)) should supply the data we need. Just do dput(mydata) where mydata is your data. Copy the output and paste it here between
```

```

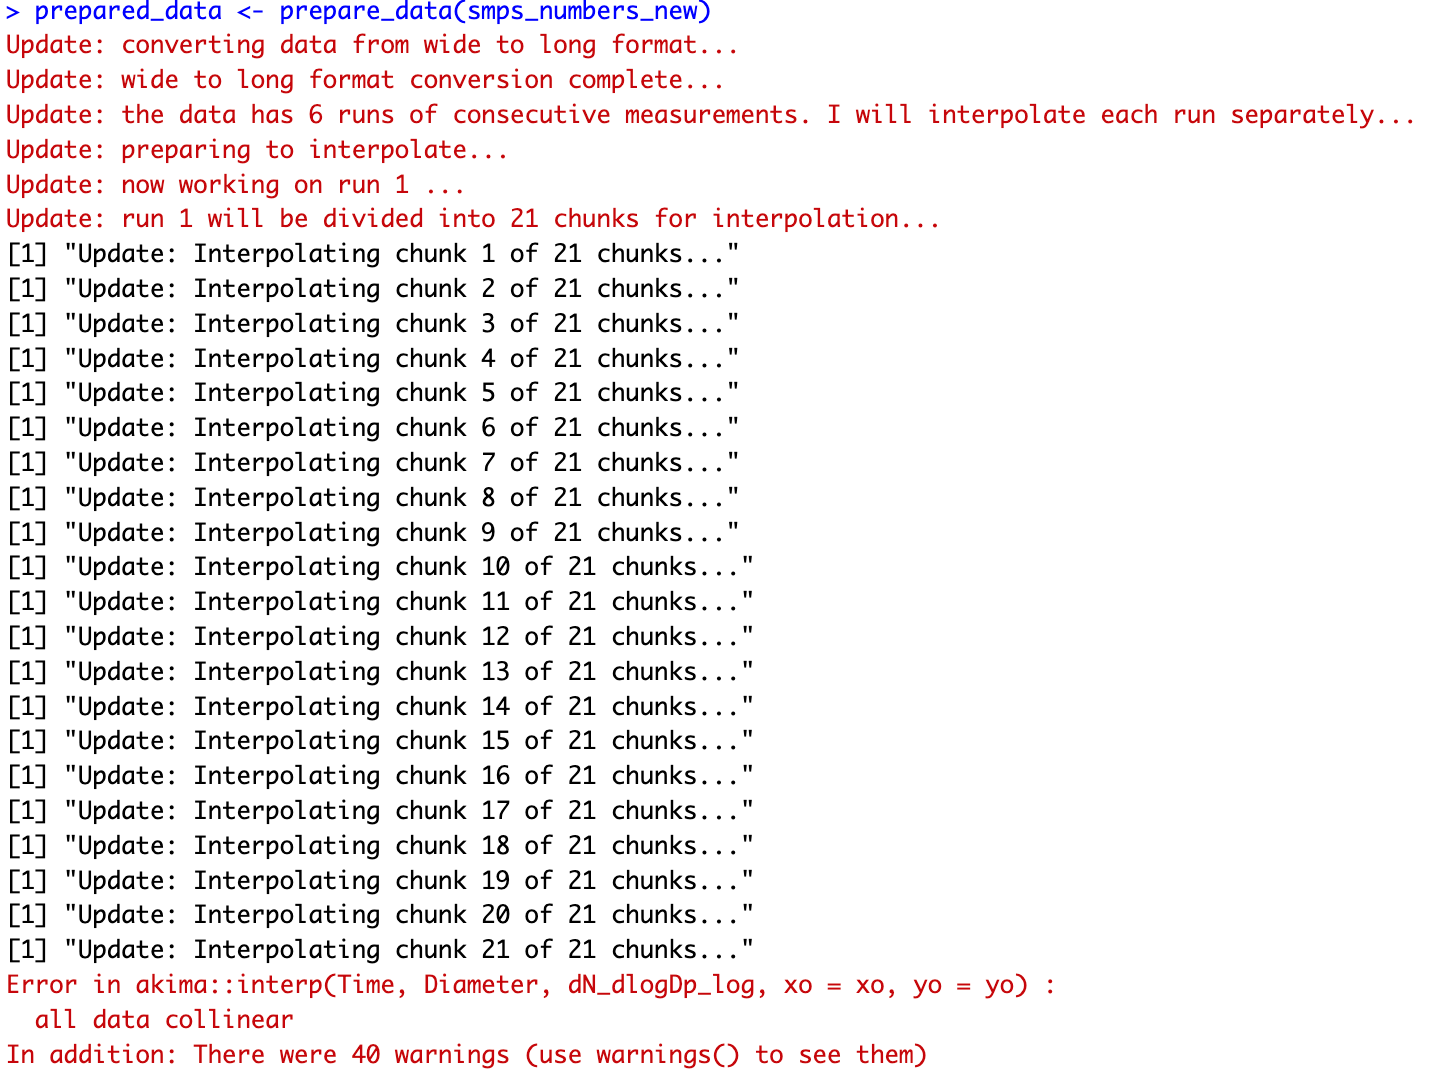
I do not see that. Your data has 19359 rows of nothing but NA's. So out of 28535188 data points 2071413 of them are NA.

You really cannot see this in R or a spreadsheet but if you open the .csv file in a text editor this is what the last two rows of your raw data look like

,,,,,,,,,,,,,,,,,,,,,,,,,,,,,,,,,,,,,,,,,,,,,,,,,,,,,,,,,,,,,,,,,,,,,,,,,,,,,,,,,,,,,,,,,,,,,,,,,,,,,,,,,,
,,,,,,,,,,,,,,,,,,,,,,,,,,,,,,,,,,,,,,,,,,,,,,,,,,,,,,,,,,,,,,,,,,,,,,,,,,,,,,,,,,,,,,,,,,,,,,,,,,,,,,,,,,

There in 106 commas in a row. And you have 19359 of these rows.

There are no NA's in the example data.

My guess is that you have an instrument malfunction in whatever machine is measuring those particle sizes.

I just took what looks to be valid data and had a quick look at it. I am back to thinking you do have a multicolinearity problem.

library(smps)

DT  <- read.csv("sample_smps_numbers.csv")

nn  <- 26684 - 19359  ## Get the number of apparently usable rows of data. 

DT  <- DT[1 : nn, ]

cor(DT[, 2:12])

This topic was automatically closed 42 days after the last reply. New replies are no longer allowed.

If you have a query related to it or one of the replies, start a new topic and refer back with a link.