Hi. I am working on replicating some Stata margins commands in R, and I was wondering if there is an easy way to find a single point prediction at a specified high and low value of a variable. In Stata, the output looks like this:
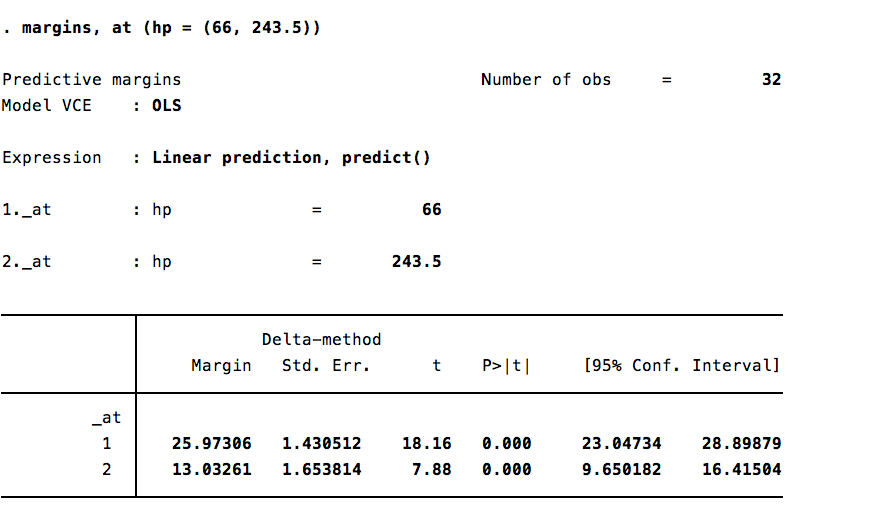
The "Margin" displayed in the table is the predicted value of the dependent variable when hp is equal to first 66 (case 1) and then 243.5 (case 2) for all of the data points. In R, the default output of the corresponding margins command is to instead give the Average Marginal Effect (AME) of a 1 unit change in the variable of interest. Thus, it is possible to replicate the Stata results (see reprex below using an example from the built-in mtcars dataset) by manually calculating the point prediction for each observation. I did this by first multiplying the AME by the change in the variable of interest resulting from mandating it at a certain value, and next adding that to the dependent variable for that observation. Finally, I took the average of these calculations for all data points to get the final result displayed by Stata. I am wondering, though, if there is a built-in function to have R simply output these results just like Stata does to avoid the manual calculation? I can not seem to find it online. Thank you for the help!
library(margins)
library(tidyverse)

# use the included mtcars dataset

# run a simple regression

x1 <- lm(mpg ~ hp + carb, data = mtcars)

# use the margins command to get the output

m <- margins(x1, at = list(hp = c(66, 243.5)))

# print results to 10 digits

print(m, digits = 10)
#> Average marginal effects at specified values
#> lm(formula = mpg ~ hp + carb, data = mtcars)
#>  at(hp)             hp         carb
#>    66.0 -0.07290395619 0.2647004172
#>   243.5 -0.07290395619 0.2647004172

# manually save the AME on hp (is there a way to pull this directly from m?)

margins_hp = -0.07290395619

# manually create a new variable for the point prediction given the high/low value for hp

mtcars$predict_low = mtcars$mpg + (66 - mtcars$hp) * (margins_hp)
mtcars$predict_high = mtcars$mpg + (243.5 - mtcars$hp) * (margins_hp)

# find the mean point prediction given the high/low value for hp

(mean(mtcars$predict_low))
#> [1] 25.97306
(mean(mtcars$predict_high))
#> [1] 13.03261
Created on 2020-04-05 by the reprex package (v0.3.0)
Note: this is an attempt to break down my larger, related problem which I posted about here.