saurabh
February 26, 2022, 11:31pm
1
here is my dataframe
data.frame(Subtype = c("OPC", "Hypopharynx", "Larynx"),
             alive = c(88, 22, 100),
              dead = c(12, 55, 17),
         uncertain = c(10, 2, 2),
             total = c(186, 46, 202)
I've loaded the ggplot2 package. what I want is something quite simple but struggling to get it.
I want the Subtype variable (i.e.OPC, Hypopharynx, Larynx) as my 'X' with the number of patients (i.e. Total) in the 'Y' axis displayed in the form of a BarChat
I've tried the following code
ggplot(data = tata3, aes(x=Subtype, y=total)) + geom_histogram()
and also
ggplot(data = tata3, aes(x=Subtype, y=total)) + geom_bar()
to no Avail. Can someone please help? thanks
saurabh
February 26, 2022, 11:33pm
2
tata3 is definitely the name of my dataframe
FJCC
February 26, 2022, 11:38pm
3
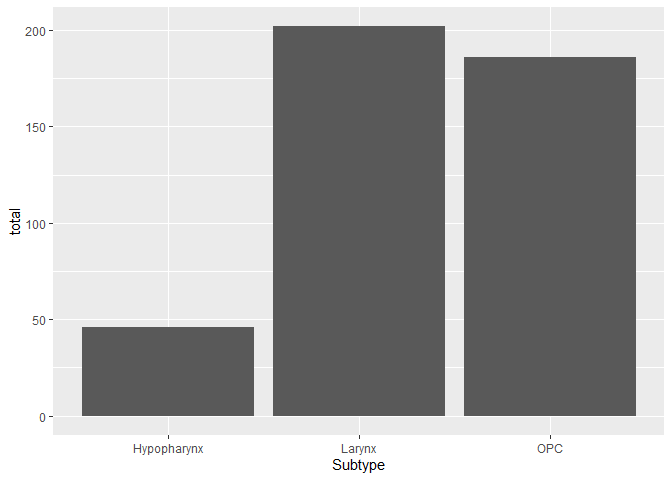
You need to use geom_col() instead of geom_bar(). geom_bar() counts how many times a category appears in the data to set the bar height and geom_col() uses values in the data to determine the column height. This is explained in the Help file accessed with ?geom_bar.
library(ggplot2)
tata3 <- data.frame(Subtype = c("OPC", "Hypopharynx", "Larynx"),
           alive = c(88, 22, 100),
           dead = c(12, 55, 17),
           uncertain = c(10, 2, 2),
           total = c(186, 46, 202))
ggplot(data = tata3, aes(x=Subtype, y=total)) + geom_col()
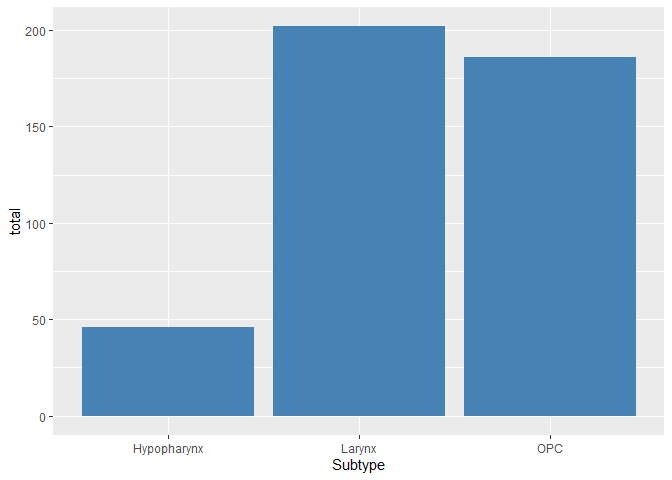
#better color
ggplot(data = tata3, aes(x=Subtype, y=total)) + geom_col(fill="steelblue")
Created on 2022-02-26 by the reprex package (v2.0.1)
2 Likes
saurabh
February 26, 2022, 11:48pm
4
Many thanks
I think I had 'Stringsasfactors = false' in my data frame which I think might have prevented me from getting the plot.
It's worked now
saurabh
February 27, 2022, 12:00am
5
Also, I try this code to have each bar in a different color
ggplot (data = tata3, aes(x=Subtype, y =total)) + geom_col() + scale_fill_manual(values = c("Hypopharynx" = "Red", "Larynx" = "Green", "OPC" = "blue"), aesthetics = c("color", "fill"))
But all the bars still appear in one colour - black. What Am I doing wrong? thanks
FJCC
February 27, 2022, 12:20am
6
You need to tell geom_col() to use Subtype to control the fill aesthetic.
ggplot (data = tata3, aes(x=Subtype, y =total, fill = Subtype)) +
  geom_col() + scale_fill_manual(values = c("Hypopharynx" = "Red", "Larynx" = "Green", "OPC" = "blue"),
                                 aesthetics = c("color", "fill"))
By the way, this is sufficient:
ggplot (data = tata3, aes(x=Subtype, y =total, fill = Subtype)) +
  geom_col() +
  scale_fill_manual(values = c("Hypopharynx" = "Red", "Larynx" = "Green", "OPC" = "blue"))
system
March 6, 2022, 12:21am
7
This topic was automatically closed 7 days after the last reply. New replies are no longer allowed.