Simple pivoting

I have this df:

x <- rbind(
  data.frame(time = "Pre", treatment = "Control", response = rnorm(100, mean=2)),
  data.frame(time = "Pre", treatment = "Treatment", response = rnorm(100, mean=1)),
  data.frame(time = "Post", treatment = "Control", response = rnorm(100, mean=1)),
  data.frame(time = "Post", treatment = "Treatment", response = rnorm(100, mean=3))
) %>%
mutate(time = factor(time, levels = c("Pre", "Post")))

x <- x %>% mutate(id = row_number())

I want to pivot it somehow so I will get columns: Control - with pre and post levels in it and Treatment with pre and post levels in it. Values will go to Values column obviously.
How do I do it, please give me some advice.

I don't see a useful way to pivot the data if every row has a unique id value. Would it make sense to have 100 id values rather than 400?

library(tidyr)
library(dplyr)
#> 
#> Attaching package: 'dplyr'
#> The following objects are masked from 'package:stats':
#> 
#>     filter, lag
#> The following objects are masked from 'package:base':
#> 
#>     intersect, setdiff, setequal, union
x <- rbind(
  data.frame(time = "Pre", treatment = "Control", response = rnorm(100, mean=2)),
  data.frame(time = "Pre", treatment = "Treatment", response = rnorm(100, mean=1)),
  data.frame(time = "Post", treatment = "Control", response = rnorm(100, mean=1)),
  data.frame(time = "Post", treatment = "Treatment", response = rnorm(100, mean=3))
) |> 
  mutate(time = factor(time, levels = c("Pre", "Post")))

x <- x |>  mutate(id = rep(1:100, 4))
x_wide <- x |> pivot_wider(names_from = c("treatment", "time"), values_from = "response")
head(x_wide)
#> # A tibble: 6 × 5
#>      id Control_Pre Treatment_Pre Control_Post Treatment_Post
#>   <int>       <dbl>         <dbl>        <dbl>          <dbl>
#> 1     1        2.46         0.428        2.83            1.05
#> 2     2        4.90         3.52         1.20            1.86
#> 3     3        1.81         0.512       -0.222           3.52
#> 4     4        3.17         0.248        1.85            3.38
#> 5     5        2.28         2.39         2.79            2.89
#> 6     6        2.05        -0.807        1.20            3.27

Created on 2024-01-21 with reprex v2.0.2

Yes, this is going in good direction, but one patient could only be in either of two groups: Control or Treatment.
That looks like is placed in both simultaneously.

Like this?

library(tidyr)
library(dplyr)
#> 
#> Attaching package: 'dplyr'
#> The following objects are masked from 'package:stats':
#> 
#>     filter, lag
#> The following objects are masked from 'package:base':
#> 
#>     intersect, setdiff, setequal, union
x <- rbind(
  data.frame(time = "Pre", treatment = "Control", response = rnorm(100, mean=2)),
  data.frame(time = "Pre", treatment = "Treatment", response = rnorm(100, mean=1)),
  data.frame(time = "Post", treatment = "Control", response = rnorm(100, mean=1)),
  data.frame(time = "Post", treatment = "Treatment", response = rnorm(100, mean=3))
) |> 
  mutate(time = factor(time, levels = c("Pre", "Post")))

x <- x |>  mutate(id = rep(1:200, 2))
x_wide <- x |> pivot_wider(names_from = c( "time"), values_from = "response")
head(x_wide)
#> # A tibble: 6 × 4
#>   treatment    id   Pre    Post
#>   <chr>     <int> <dbl>   <dbl>
#> 1 Control       1  3.49 -0.235 
#> 2 Control       2  2.21 -0.114 
#> 3 Control       3  1.35 -0.170 
#> 4 Control       4  2.90  1.09  
#> 5 Control       5  2.48 -0.627 
#> 6 Control       6  1.74  0.0904
tail(x_wide)
#> # A tibble: 6 × 4
#>   treatment    id    Pre  Post
#>   <chr>     <int>  <dbl> <dbl>
#> 1 Treatment   195  0.413 3.69 
#> 2 Treatment   196  1.68  3.51 
#> 3 Treatment   197  1.10  2.08 
#> 4 Treatment   198 -0.588 2.88 
#> 5 Treatment   199  0.882 3.36 
#> 6 Treatment   200  0.698 0.888

Created on 2024-01-22 with reprex v2.0.2

1 Like

Yes, thank you very much (this is good), if I may ask additionally as in my first OP,

So I will have got let's say a variable Control and in it pre and post values and variable Treatment and pre and post values (words/strings) in it and additional column where numbers will be placed accordingly . Is this possible ?

what you asked for seems to match exactly the starting dataset you provided?

In my first post I provided this:

obraz

What I would like to achieve (if possible) is this:

obraz

I do not know if this can be done as one dataframe or two separated dataframes ?
So basically I removed time variable.

what is the operation you are performing here ?
if you did it by hand, what would you be doing ?

it seems like measurments are taken, a measurement gets taken at a certain time; that time is is pre or post some known time. the measurement relates to something that was either in a treatment group or a control group. All this seems straightforward inthe first post. in what you want to achieve what is the interpretation ?
is it that yould have NA values ? where a control was Pre or Post if it was a control, but be NA if it came from a treatment record, (or vice - versa) ?
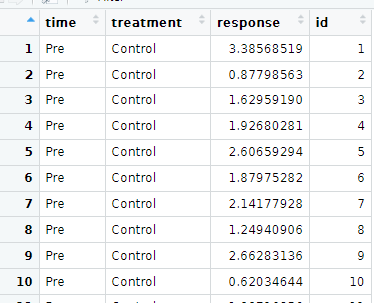
(x <- rbind(
  data.frame(time = "Pre", treatment = "Control", response = rnorm(100, mean=2)),
  data.frame(time = "Pre", treatment = "Treatment", response = rnorm(100, mean=1)),
  data.frame(time = "Post", treatment = "Control", response = rnorm(100, mean=1)),
  data.frame(time = "Post", treatment = "Treatment", response = rnorm(100, mean=3))
) |> 
  mutate(time = factor(time, levels = c("Pre", "Post")),
         id=row_number()))


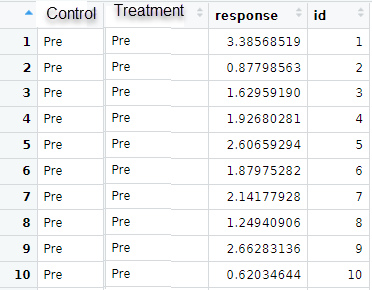
widerx <- pivot_wider(x,
            names_from="treatment",
            values_from = "time")

# you can use widerx

# looks at a summary of it to see if it makes sense /is what is expected 
group_by(widerx,
         Control,Treatment) |> summarise(n=n(),mean_response=mean(response))

Yes, thank you, this is what I expected, I will divide widerx dataframe into two dfs in order to get rid of Nas and it will be better for me to present it on the graph.

This topic was automatically closed 42 days after the last reply. New replies are no longer allowed.

If you have a query related to it or one of the replies, start a new topic and refer back with a link.