Just to show a different way of doing this, here's a solution using base R and matrices. In general, I suggest (and personally use) code like @mishabalyasin showed. Tables are great for organizing and reasoning about data. However, matrices and arrays have some benefits:
- Efficiency, both for memory size and processing time.
- Near universality, in that most functions are vectorized or even "array-ized." This can lead to cleaner code without much indexing notation.
- Matrix algebra (of course).
This example's actually pretty good for showcasing all three, though the benefit to efficiency is tiny given the amount of data.
Because each number returned by rnorm is independent, and the inner loop always goes from 1 to 30, we can remove the inner loop by generating a chunk of numbers at once and storing them as a matrix. When you give var to the whole thing. The values along the result's diagonal are each column's variance.
set.seed(2)

# Separately defining a named function helps clarify code
sized_variances <- function(n, iterations) {
  x <- rnorm(n * iterations, mean = 10, sd = 2)
  dim(x) <- c(n, iterations)
  diag(var(x))
}
Because what'll actually be plotted, the variance of a vector, will always be a single number no matter the input's length, we know we'll get 30 numbers back for each value of n. So vapply is a good candidate for the outer loop.
n_values <- seq(3, 31, 2)

variances <- vapply(
  X          = n_values,
  FUN        = sized_variances,
  FUN.VALUE  = numeric(30),
  iterations = 30
)

str(variances)
# num [1:30, 1:15] 6.57 4.24 5.78 1.71 1.65 ...

variances[1:5, 1:5]
#          [,1]      [,2]     [,3]     [,4]     [,5]
# [1,] 6.571416 4.2608157 7.594818 2.713868 2.282991
# [2,] 4.239376 4.7380924 7.750159 2.461479 3.223732
# [3,] 5.784260 5.8654816 2.222504 4.473939 1.215411
# [4,] 1.714714 0.6747371 4.907330 5.716885 7.229157
# [5,] 1.649887 5.2541663 4.573695 2.874950 1.867682
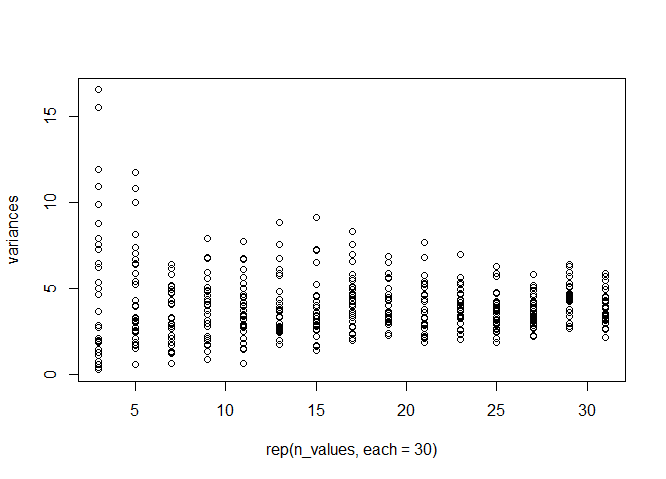
Because R is column-oriented, variances' order expressed as indices would be [1, 1], [2, 1], ..., [30, 1], [2, 1], [2, 2], and so on. It'll keep this order if converted to a vector, like the plot function will do. Knowing that, we can use rep to provide the x values.
plot(
  rep(n_values, each = 30),
  variances
)