Lekmonm
1
I need to define a number of significant figures for several columns in my dataframe, but I have not found the method to do it, except one by one.
This is the data I need to convert to 3 significant figures (not rounding decimals):
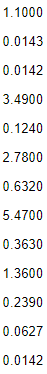
The values I need, are for example:
1.10
0.0143
0.0142
3.49
...
Thank you.
Are you attempting to truncate the values before continuing to compute ? or is this a purely presentational question ?
Lekmonm
3
It is just a matter of presentation.
myvec <-c( 1.10,0.0143,0.0142,3.49)
formatC(signif(myvec,digits=3), digits=3,format="fg", flag="#")
system
Closed
6
This topic was automatically closed 7 days after the last reply. New replies are no longer allowed.
If you have a query related to it or one of the replies, start a new topic and refer back with a link.