I've been trying to create side by side boxplots comparing data from two different time periods. I can do this easily in base R.
I cannot discover how to do it in ggplot.
# get tidyverse
library(tidyverse)
library(datapasta)
library(reprex)
# Import test data
tibble::tribble(
~Y_M_D, ~Data_1, ~Data_2, ~Data_3,
"2019-03-03", 206, 116, 57,
"2019-03-04", 103, 106, 78,
"2019-03-05", 199, 120, 84,
"2019-03-06", 110, 123, 80,
"2019-03-07", 123, 131, 65,
"2019-03-08", 145, 144, 76,
"2019-03-09", 158, 106, 75,
"2019-03-10", 114, 129, 82,
"2019-03-11", 166, 115, 55,
"2019-03-12", 100, 137, 83
)
#> # A tibble: 10 x 4
#> Y_M_D Data_1 Data_2 Data_3
#> <chr> <dbl> <dbl> <dbl>
#> 1 2019-03-03 206 116 57
#> 2 2019-03-04 103 106 78
#> 3 2019-03-05 199 120 84
#> 4 2019-03-06 110 123 80
#> 5 2019-03-07 123 131 65
#> 6 2019-03-08 145 144 76
#> 7 2019-03-09 158 106 75
#> 8 2019-03-10 114 129 82
#> 9 2019-03-11 166 115 55
#> 10 2019-03-12 100 137 83
tibble::tribble(
~Y_M_D, ~Data_1, ~Data_2, ~Data_3,
"2019-06-01", 162, 135, 66,
"2019-06-02", 150, 146, 63,
"2019-06-03", 128, 131, 80,
"2019-06-04", 101, 123, 82,
"2019-06-05", 158, 143, 68,
"2019-06-06", 210, 125, 64,
"2019-06-07", 195, 120, 77,
"2019-06-08", 204, 126, 83,
"2019-06-09", 107, 121, 83,
"2019-06-10", 179, 144, 57
)
#> # A tibble: 10 x 4
#> Y_M_D Data_1 Data_2 Data_3
#> <chr> <dbl> <dbl> <dbl>
#> 1 2019-06-01 162 135 66
#> 2 2019-06-02 150 146 63
#> 3 2019-06-03 128 131 80
#> 4 2019-06-04 101 123 82
#> 5 2019-06-05 158 143 68
#> 6 2019-06-06 210 125 64
#> 7 2019-06-07 195 120 77
#> 8 2019-06-08 204 126 83
#> 9 2019-06-09 107 121 83
#> 10 2019-06-10 179 144 57
library(readxl)
timeframe_1 <- test_file <- read_excel("~/Downloads/test_file.xlsx",
sheet = "time_one")
#
timeframe_2 <- test_file <- read_excel("~/Downloads/test_file.xlsx",
sheet = "time_two")
#
dpasta(timeframe_1)
#> tibble::tribble(
#> ~Y_M_D, ~Data_1, ~Data_2, ~Data_3,
#> "2019-03-03", 206, 116, 57,
#> "2019-03-04", 103, 106, 78,
#> "2019-03-05", 199, 120, 84,
#> "2019-03-06", 110, 123, 80,
#> "2019-03-07", 123, 131, 65,
#> "2019-03-08", 145, 144, 76,
#> "2019-03-09", 158, 106, 75,
#> "2019-03-10", 114, 129, 82,
#> "2019-03-11", 166, 115, 55,
#> "2019-03-12", 100, 137, 83
#> )
dpasta(timeframe_2)
#> tibble::tribble(
#> ~Y_M_D, ~Data_1, ~Data_2, ~Data_3,
#> "2019-06-01", 162, 135, 66,
#> "2019-06-02", 150, 146, 63,
#> "2019-06-03", 128, 131, 80,
#> "2019-06-04", 101, 123, 82,
#> "2019-06-05", 158, 143, 68,
#> "2019-06-06", 210, 125, 64,
#> "2019-06-07", 195, 120, 77,
#> "2019-06-08", 204, 126, 83,
#> "2019-06-09", 107, 121, 83,
#> "2019-06-10", 179, 144, 57
#> )
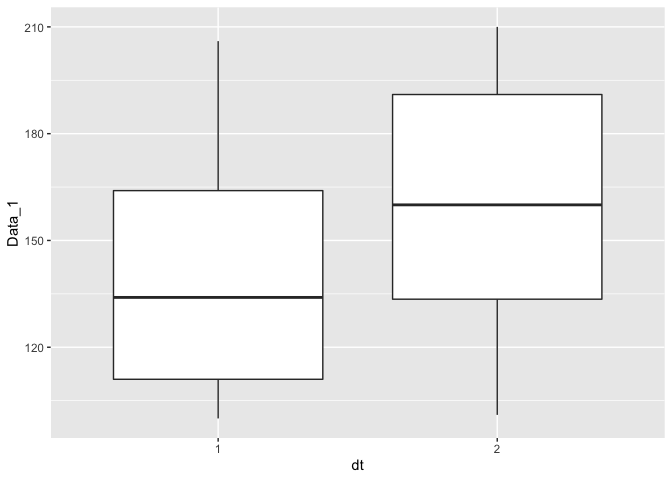
# I want a boxplot showing timeframe_1 & timeframe_2 side by side
# displaying values in data_1 column
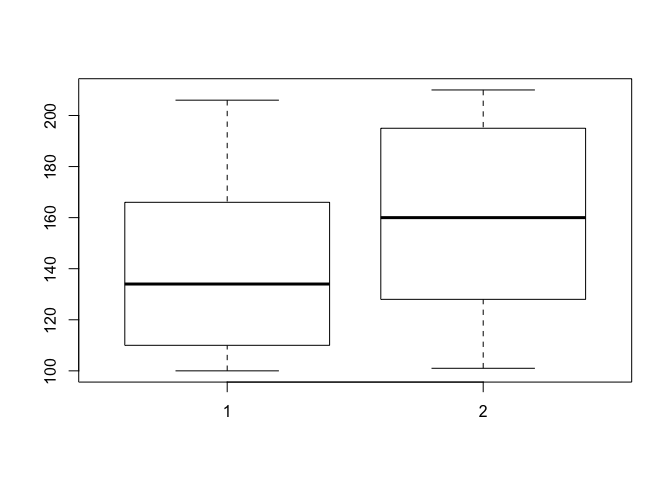
# I can do this easily in base R. For example:
boxplot(timeframe_1$Data_1,timeframe_2$Data_1)
# How can it be done using ggplot?
Created on 2019-07-08 by the reprex package (v0.3.0)