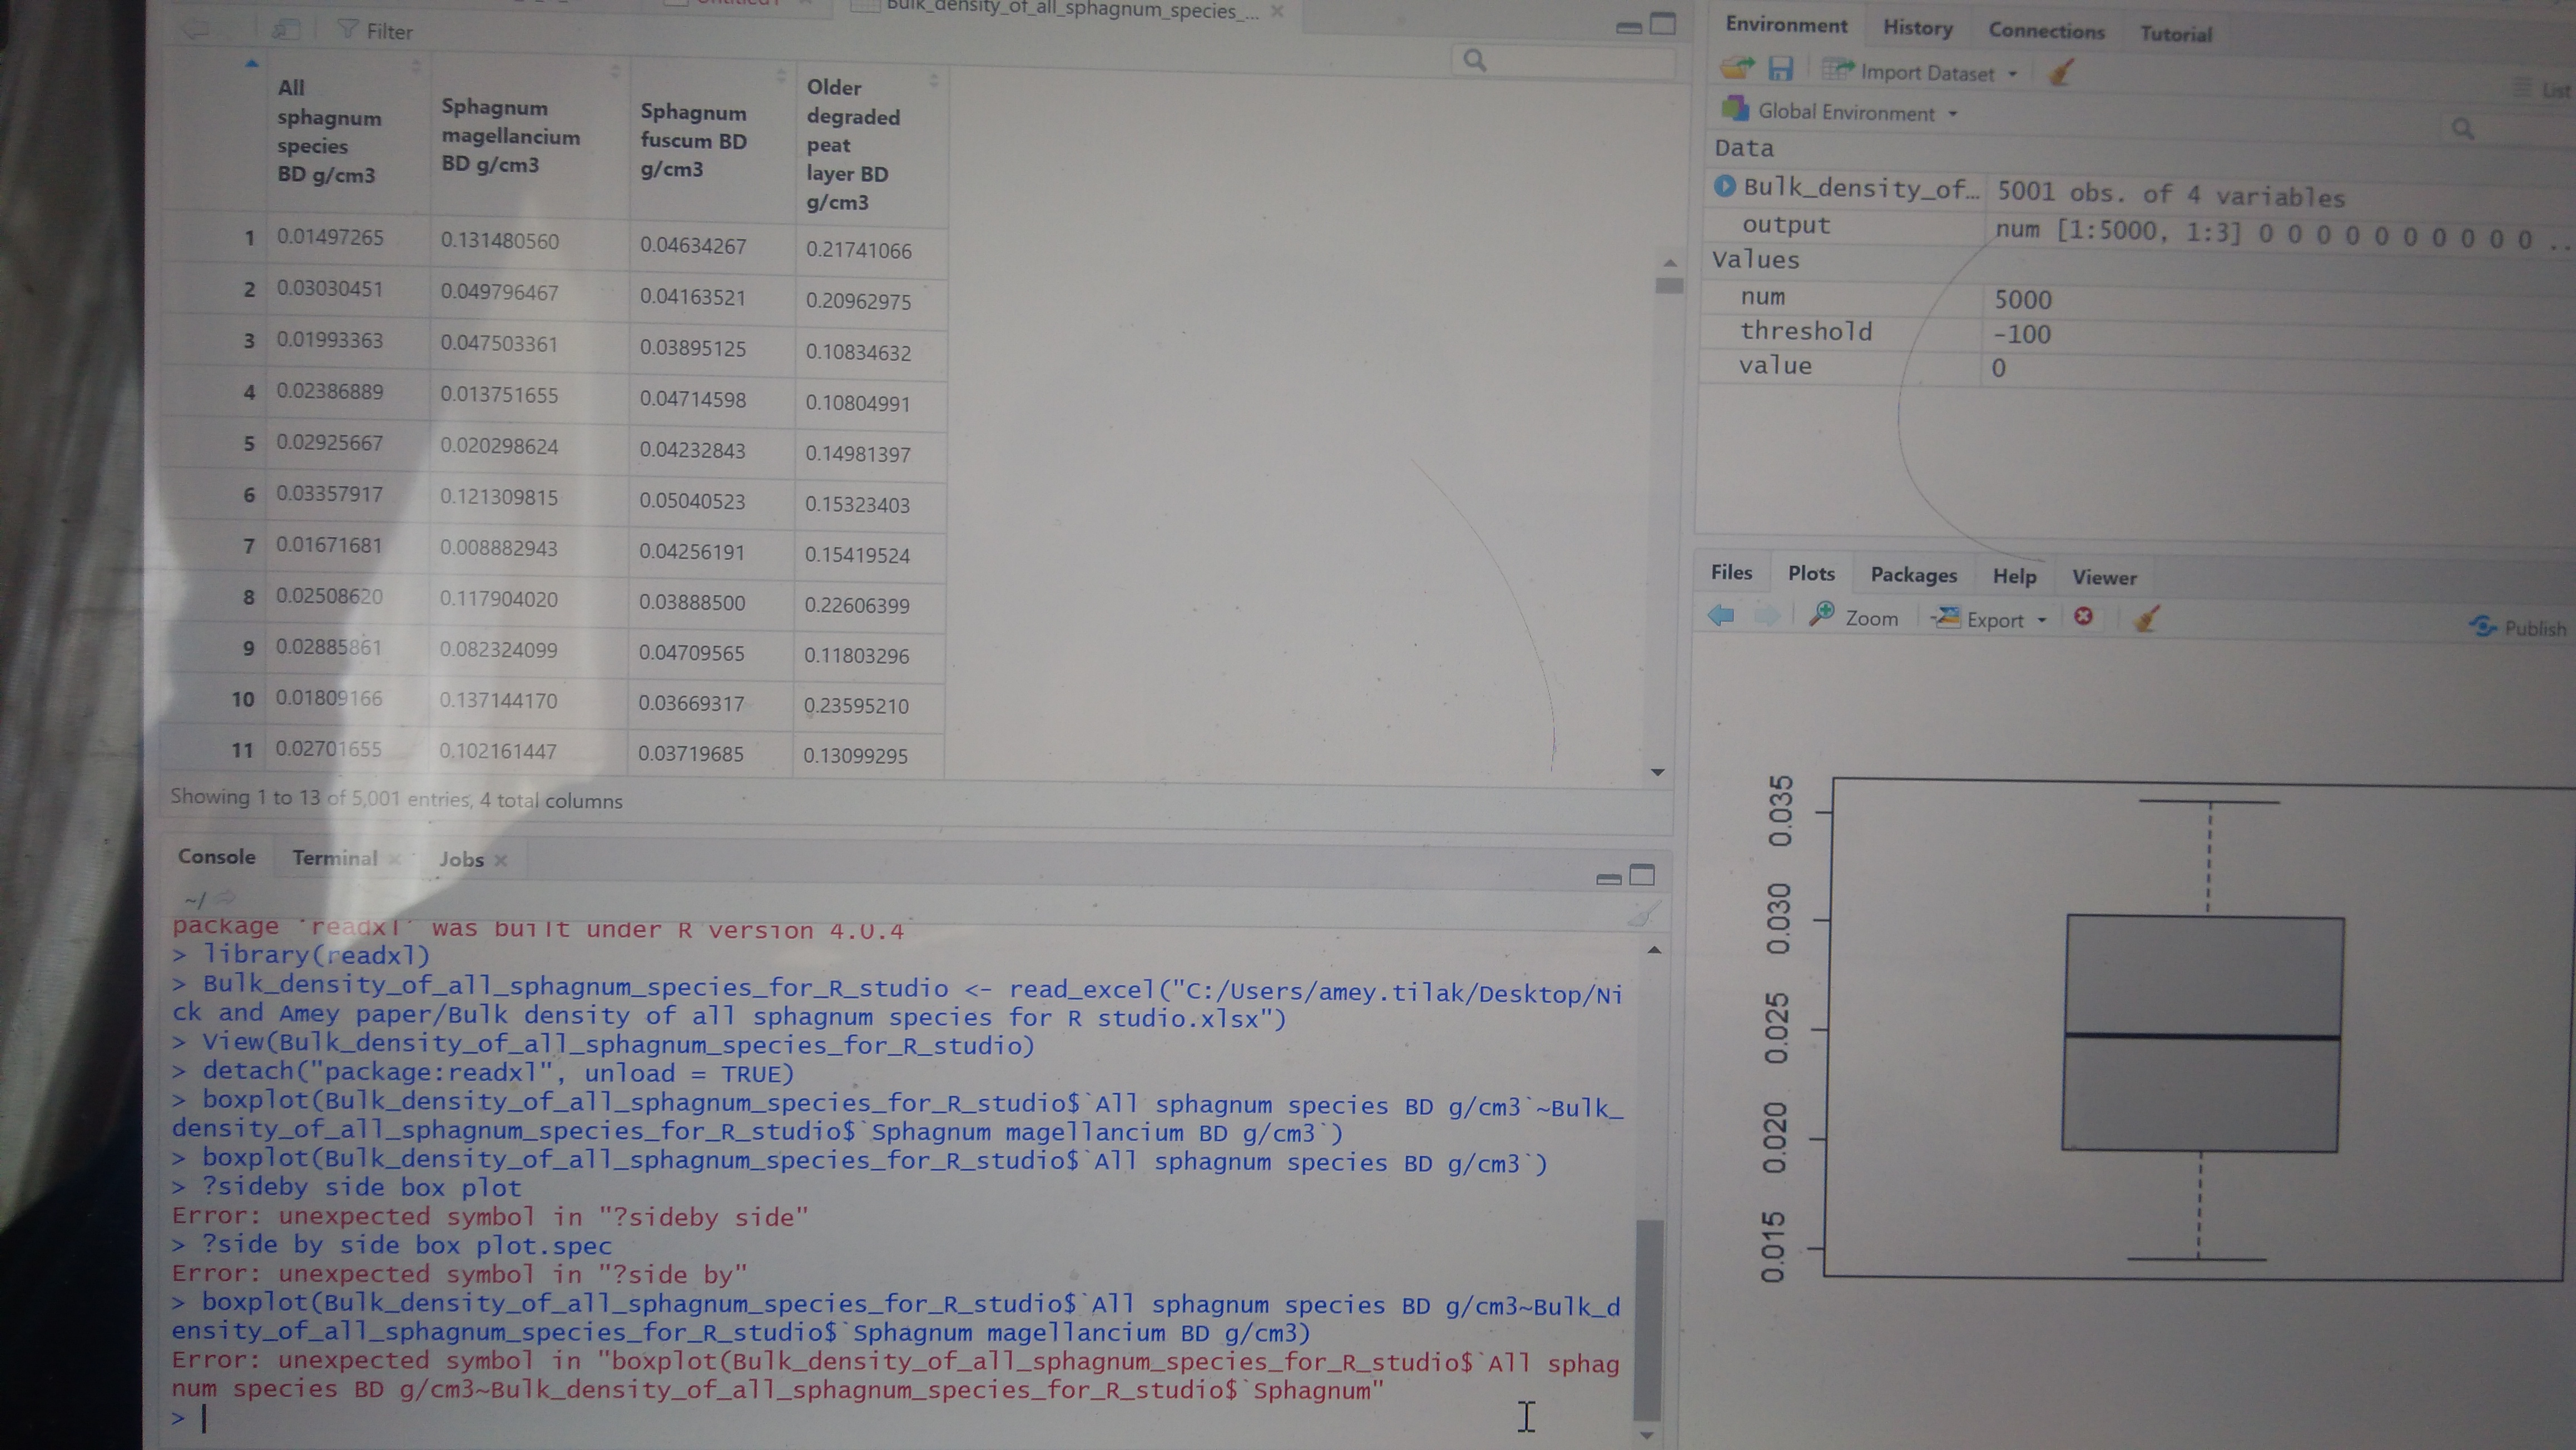
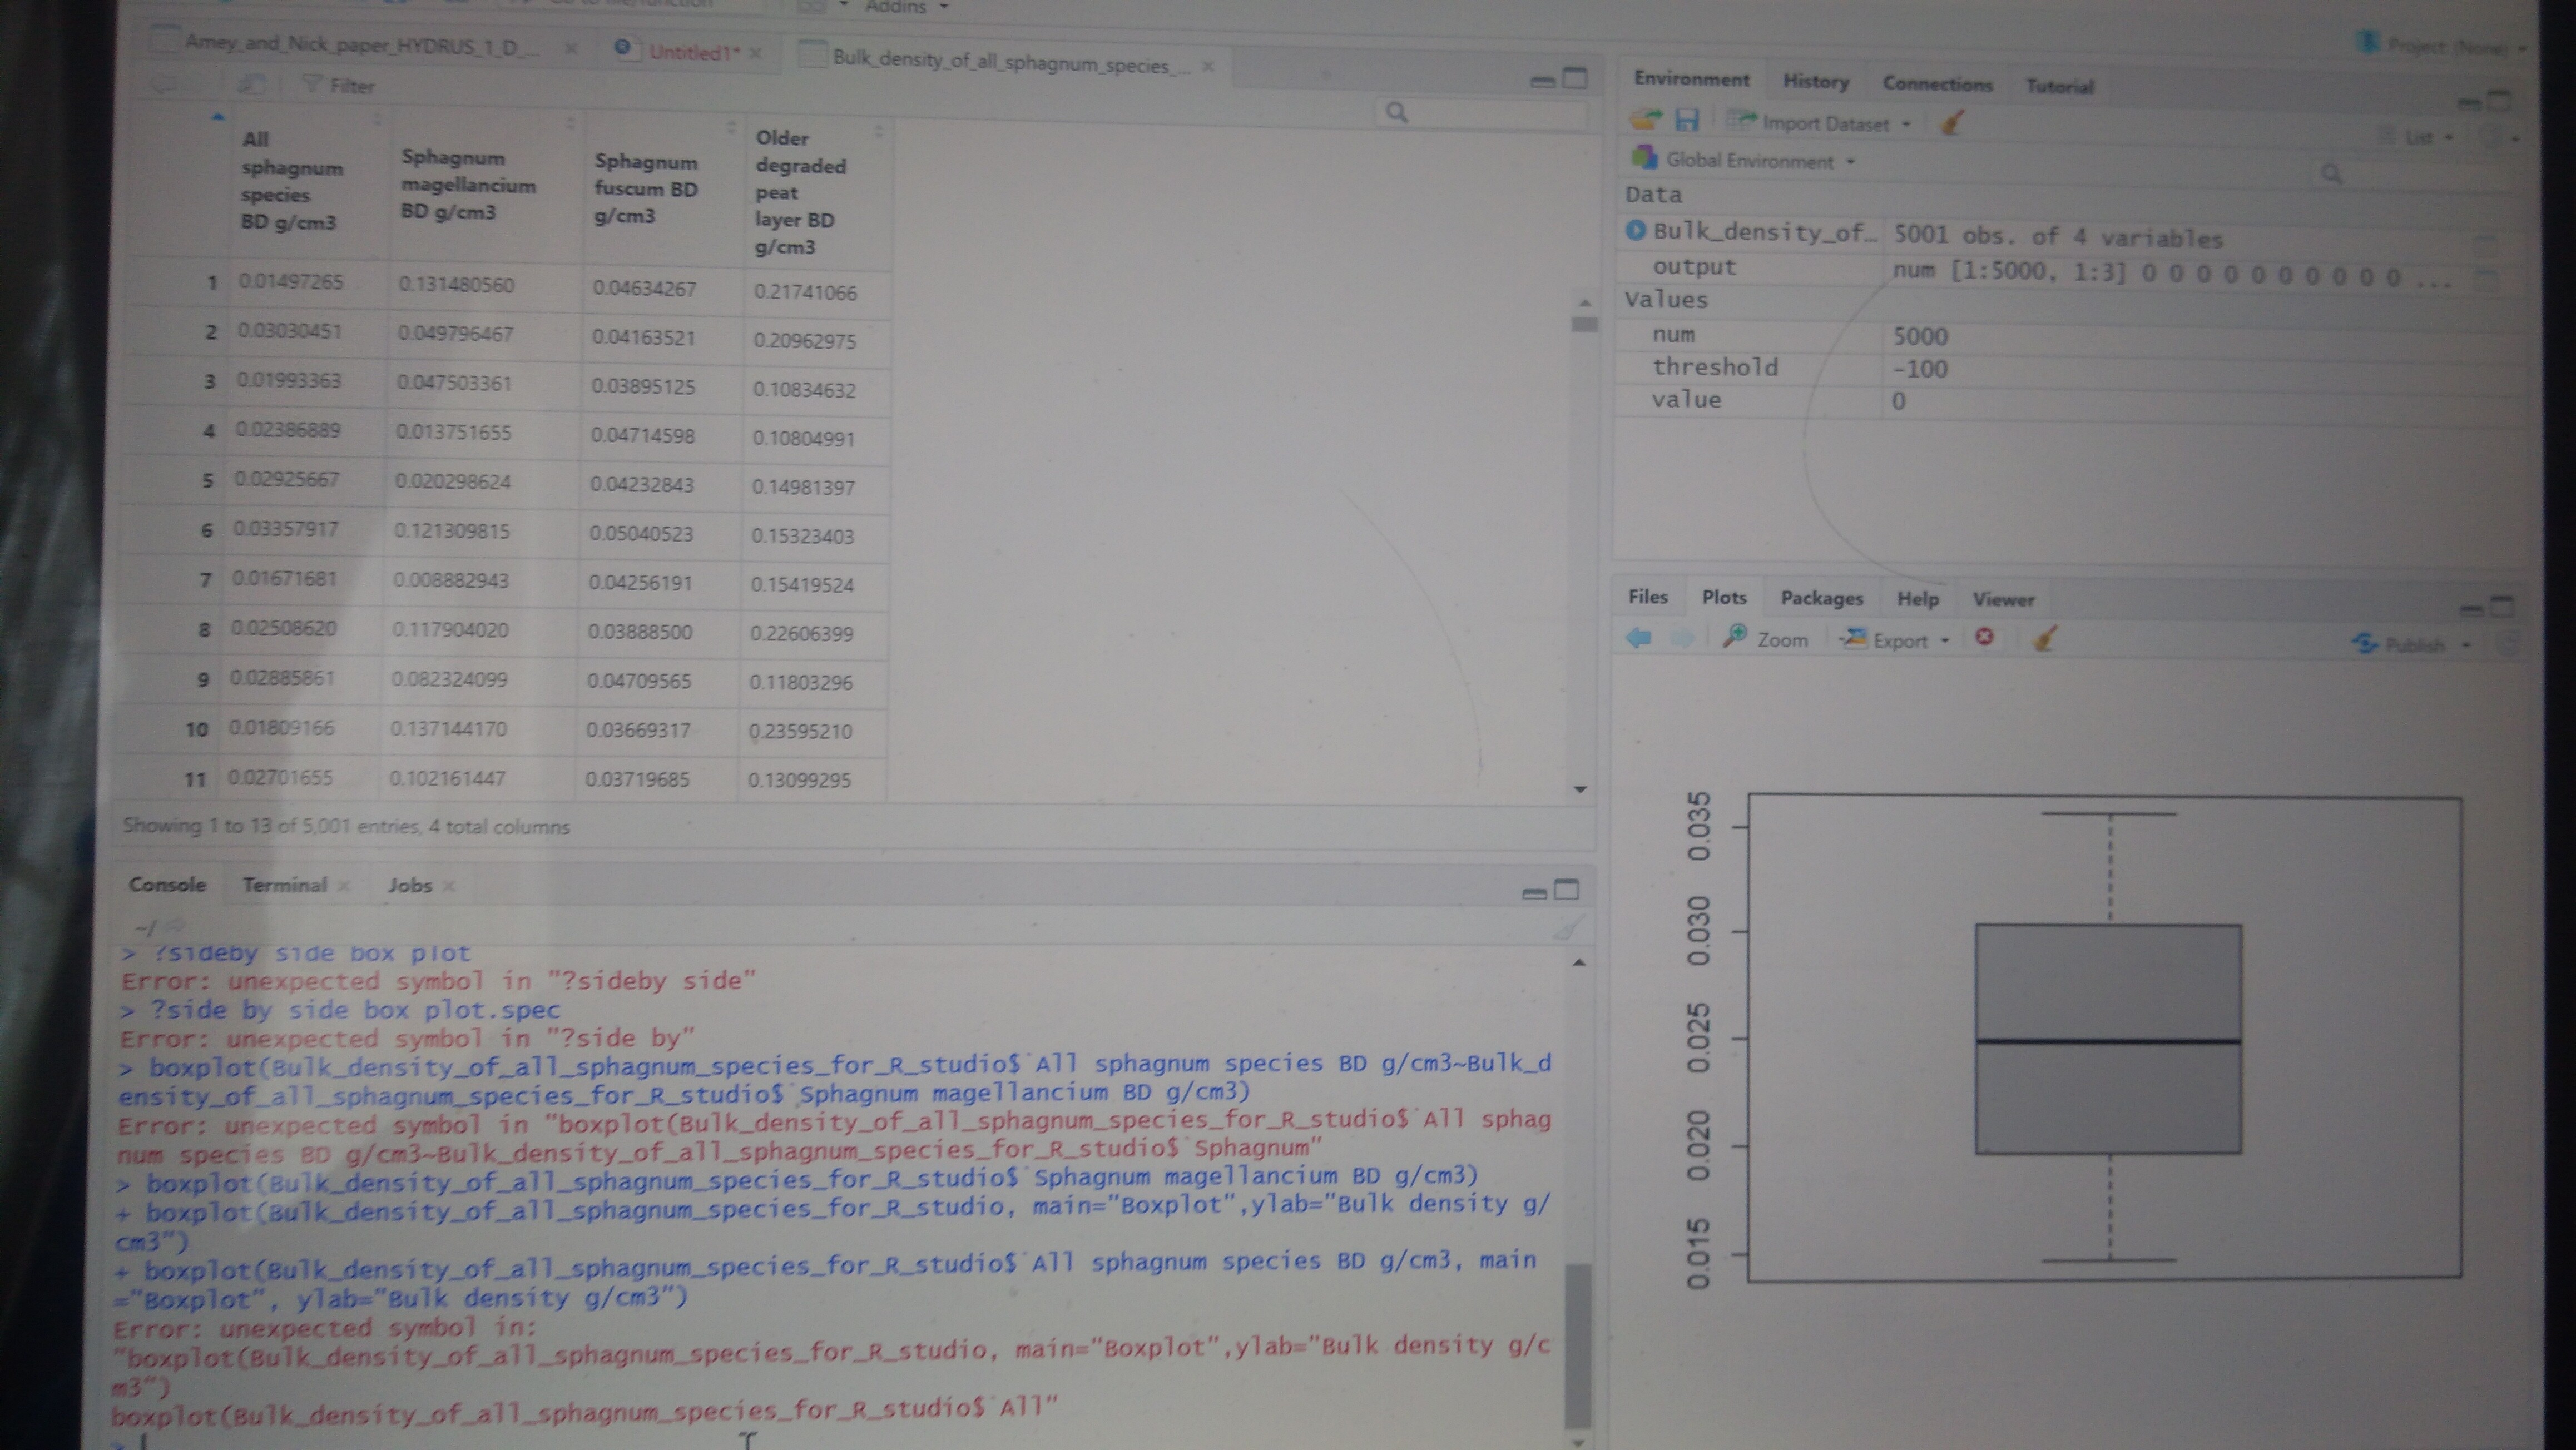
I have imported excel data for drawing box plots in R i.e. side by side box plots. Can someone look at the image and suggest why I cannot draw side by side box plots.
A major difference between Excel and R is that R often likes data in long format. Instead of having one column for each category, R prefers to have a column that lists the category and a column for the value. I invented some data that has four column and I reshaped it using pivot_longer() to a long format. I used the head() function only to show the data in this post. It isn't required to make the code work.
DF <- data.frame(A = rnorm(25), B = rnorm(25), C = rnorm(25), D = rnorm(25))
head(DF)
#>            A          B          C          D
#> 1  0.2981999 -0.6484864 -1.2964685 -1.7083513
#> 2 -1.2827663  0.3492018  1.5241245  0.6773452
#> 3  0.4845429  0.2821930 -1.5178429  1.1980959
#> 4 -0.2237288  1.2532181  0.1238061 -0.9233621
#> 5  1.1575646  1.4269752 -0.6579066  0.8811419
#> 6  2.6697766 -0.5152628  1.9332511 -1.6036344
library(tidyr)
DFlong <- pivot_longer(data = DF, cols = everything())
head(DFlong)
#> # A tibble: 6 x 2
#>   name   value
#>   <chr>  <dbl>
#> 1 A      0.298
#> 2 B     -0.648
#> 3 C     -1.30
#> 4 D     -1.71
#> 5 A     -1.28
#> 6 B      0.349
boxplot(value ~ name, data = DFlong)
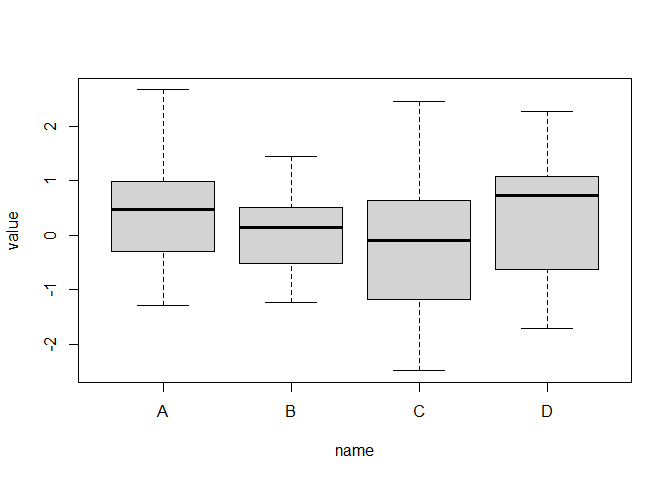
Created on 2021-04-20 by the reprex package (v0.3.0)
This topic was automatically closed 21 days after the last reply. New replies are no longer allowed.
If you have a query related to it or one of the replies, start a new topic and refer back with a link.