library(dplyr)
library(ggplot2)
mat = matrix(
c(
0.5, 0.2, 0.8, 1,
0.35, 0.49, 0, 0.71
),
dimnames = list(
c(
"ratio_1", "ratio_2", "ratio_3", "ratio_4",
"ratio_5", "ratio_6", "ratio_7", "ratio_8"
)
)
)
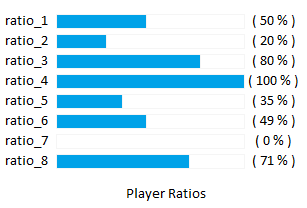
DF <- data.frame(Name = dimnames(mat)[[1]], Value = mat, Dummy = rep(1, 8),
Label = c("(50%)", "(20%)", "(80%)", "(100%)", "(35%)",
"(49%)", "(0%)", "(71%)"),
LabelPos = 1.1)
DF <- mutate(DF, Name = factor(Name, levels =c(
"ratio_8", "ratio_7", "ratio_6", "ratio_5",
"ratio_4", "ratio_3", "ratio_2", "ratio_1") ))
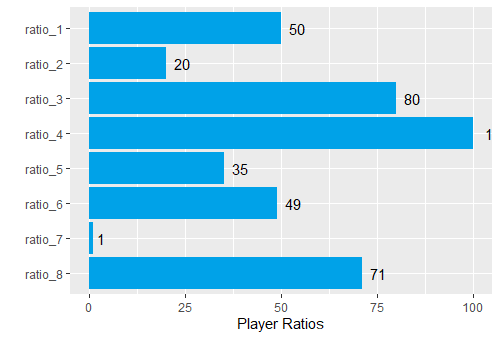
ggplot(data = DF, aes(x=Name, y=Value)) + geom_col(fill = "skyblue") +
geom_col(aes(y = Dummy), fill = "white", color = "grey50", alpha = 0) +
scale_y_continuous(expand = c(-0.1, .2)) +geom_text(aes(y = LabelPos, label = Label)) +
labs(x = "", y = "Player Ratios") +
theme_minimal() + theme(axis.text.x = element_blank(),
panel.grid.major = element_blank(),
panel.grid.minor = element_blank()) + coord_flip()

Created on 2019-09-11 by the reprex package (v0.2.1)