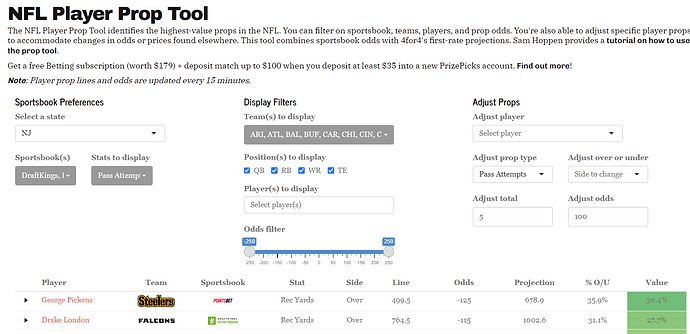
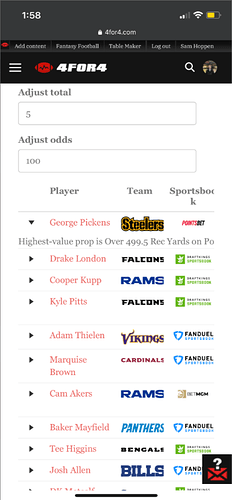
I have a Shiny app that is embedded on a website using iframe (see first screenshot below). However, I'm trying to make this app more user-friendly when users are on the website via mobile. Currently, all of the filters are just stacked on top of one another (which is fine), but it cuts off the table (a reactable table) considerably to the point that you can only see ~3 columns at a time (see second screenshot). Is there a way for Shiny to recognize when a user is viewing something on mobile and to automatically remove some columns that aren't as necessary?
I've included the code for the renderReactable portion of the app in case there is some adjusting that can be made there:
output$bet_values <- renderReactable({
    GnYlRd <- function(x) rgb(colorRamp(c("#f87274", "#ffeb84", "#63be7b"))(x), maxColorValue = 255)

    reactable(value_data(),
              details = function(index){ paste0("Projection: ", value_data()[index,]$Projection, "\n", "Line: ",
                                                value_data()[index,]$Line)},

              columns = list(
        Player = colDef(minWidth = 120,
                        cell = function(Player, bet_id) {
                            url <- value_data()[bet_id, "URL"]
                            htmltools::tags$a(href = as.character(url), target = "_blank", as.character(Player))}),
        `% O/U` = colDef(minWidth = 80,
                                      format = colFormat(percent = TRUE, digits = 1),
                                      align = "center"),
        Value = colDef(minWidth = 80,
                       style = function(value) {
                           normalized <- if_else(length(value_data()$Value) == 1,
                                                 0.5,
                                                 (value - min(value_data()$Value)) / (max(value_data()$Value) - min(value_data()$Value)))
                           color <- GnYlRd(normalized)
                           list(background = color)
                       },
                       format = colFormat(percent = TRUE, digits = 1),
                       align = "center"),
        Team = colDef(align = "center",
                      minWidth = 80,
                      cell = function(value) {
                          image <- img(src = sprintf("https://raw.githubusercontent.com/samhoppen/Fantasy-Evaluator/main/Logos/NFL/%s.png", value),
                                       width = "75px", alt = value)
                      }),
        Opponent = colDef(show = FALSE),
        Stat = colDef(align = "center"),
        Sportsbook = colDef(align = "center",
                            minWidth = 100,
                            cell = function(value) {
                                image <- img(src = sprintf("https://raw.githubusercontent.com/samhoppen/Fantasy-Evaluator/main/Logos/Sportsbooks/%s.png", value),
                                             height = "16px", alt = value)
                            }),
        Projection = colDef(align = "center",
                            minWidth = 90),
        Line = colDef(align = "center",
                      minWidth = 70),
        Odds = colDef(align = "center"),
        Side = colDef(align = "center",
                      minWidth = 55),
        URL = colDef(show = FALSE),
        bet_id = colDef(show = FALSE)
    ),
    defaultPageSize = 15)
})
}
Desktop view:
Mobile view:

