hi everyone ,,,
i want to create the table that is contains data of summary rpart .. for example i want to display on table > all node that created by method rpart..
how to ?
thanks
Not sure what kind of table you're looking for.
library(rpart)
z.auto <- rpart(Mileage ~ Weight, car.test.frame)
summary(z.auto)
printpc(z.auto)
will give you a more detailed and a less detailed output table.
i want to display output of rpart method but not all just print node only
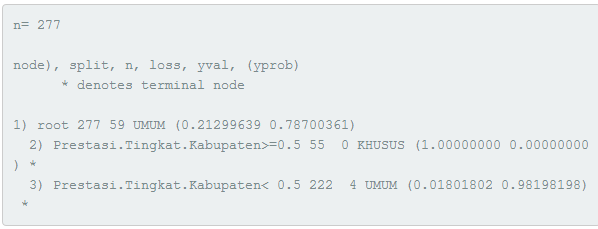
and this is actually output on table (using tableOutput shiny ) i want
 #>
# node                    split           n           loss     yval       (yprob)
# Node 1                root           277 59             Khusus  (1,00000 0.0000000)
# Node 2                prestasi.....55 0           umum
#maybe myexplanation is wrong ,, i'm sory ,,
Thanks, that helps clarify for me. 
In shiny the tableOutput renders an HTML page, but only if its object argument is a valid xtable argument, which rpart objects are not, unfortunately.
If we try to get around this using renderDataTable we need either a data frame or a matrix.
Unfortunately, an rpart object doesn't qualify for any of these alternatives. When you look at it, you see it is a list of lists:
> str(z.auto)
List of 14
 $ frame              :'data.frame':	7 obs. of  8 variables:
  ..$ var       : Factor w/ 2 levels "<leaf>","Weight": 2 2 1 2 1 1 1
  ..$ n         : int [1:7] 60 45 22 23 15 8 15
  ..$ wt        : num [1:7] 60 45 22 23 15 8 15
  ..$ dev       : num [1:7] 1354.6 361.2 61.3 117.7 60.4 ...
  ..$ yval      : num [1:7] 24.6 22.5 20.4 24.4 23.8 ...
  ..$ complexity: num [1:7] 0.59535 0.13453 0.00956 0.01283 0.01 ...
  ..$ ncompete  : int [1:7] 0 0 0 0 0 0 0
  ..$ nsurrogate: int [1:7] 0 0 0 0 0 0 0
 $ where              : Named int [1:60] 7 7 7 7 7 7 7 7 7 7 ...
  ..- attr(*, "names")= chr [1:60] "Eagle Summit 4" "Ford Escort   4" "Ford Festiva 4" "Honda Civic 4" ...
 $ call               : language rpart(formula = Mileage ~ Weight, data = car.test.frame)
 $ terms              :Classes 'terms', 'formula'  language Mileage ~ Weight
  .. ..- attr(*, "variables")= language list(Mileage, Weight)
  .. ..- attr(*, "factors")= int [1:2, 1] 0 1
  .. .. ..- attr(*, "dimnames")=List of 2
  .. .. .. ..$ : chr [1:2] "Mileage" "Weight"
  .. .. .. ..$ : chr "Weight"
  .. ..- attr(*, "term.labels")= chr "Weight"
  .. ..- attr(*, "order")= int 1
  .. ..- attr(*, "intercept")= int 1
  .. ..- attr(*, "response")= int 1
  .. ..- attr(*, ".Environment")=<environment: R_GlobalEnv>
  .. ..- attr(*, "predvars")= language list(Mileage, Weight)
  .. ..- attr(*, "dataClasses")= Named chr [1:2] "numeric" "numeric"
  .. .. ..- attr(*, "names")= chr [1:2] "Mileage" "Weight"
 $ cptable            : num [1:4, 1:5] 0.5953 0.1345 0.0128 0.01 0 ...
  ..- attr(*, "dimnames")=List of 2
  .. ..$ : chr [1:4] "1" "2" "3" "4"
  .. ..$ : chr [1:5] "CP" "nsplit" "rel error" "xerror" ...
 $ method             : chr "anova"
 $ parms              : NULL
 $ control            :List of 9
  ..$ minsplit      : int 20
  ..$ minbucket     : num 7
  ..$ cp            : num 0.01
  ..$ maxcompete    : int 4
  ..$ maxsurrogate  : int 5
  ..$ usesurrogate  : int 2
  ..$ surrogatestyle: int 0
  ..$ maxdepth      : int 30
  ..$ xval          : int 10
 $ functions          :List of 2
  ..$ summary:function (yval, dev, wt, ylevel, digits)
  ..$ text   :function (yval, dev, wt, ylevel, digits, n, use.n)
 $ numresp            : int 1
 $ splits             : num [1:3, 1:5] 60 45 23 1 1 ...
  ..- attr(*, "dimnames")=List of 2
  .. ..$ : chr [1:3] "Weight" "Weight" "Weight"
  .. ..$ : chr [1:5] "count" "ncat" "improve" "index" ...
 $ variable.importance: Named num 1006
  ..- attr(*, "names")= chr "Weight"
 $ y                  : Named int [1:60] 33 33 37 32 32 26 33 28 25 34 ...
  ..- attr(*, "names")= chr [1:60] "Eagle Summit 4" "Ford Escort   4" "Ford Festiva 4" "Honda Civic 4" ...
 $ ordered            : Named logi FALSE
  ..- attr(*, "names")= chr "Weight"
 - attr(*, "xlevels")= Named list()
 - attr(*, "class")= chr "rpart"
This means having to deconstruct the rpart components that you want and assemble them into a data frame (probably preferable, since you can use either option).
The rpart object is a list mixed objects. I haven't found a utility that will convert it into a data frame. I hope that someone else knows of one, because extracting those is going to involve a lot of indexing.
1 Like
yes of course, extracting them is almost impossible. I find it difficult to find functions that can translate the results of the rpart instantly and coherently. but thanks for all the help..
It's very much a work in progress, but you could look into the broomstick package that converts tree-based decision objects into a tidy data frame. Once you tidy the output you could display it with tableOutput or renderDataTable.
3 Likes
Very nice  but variable i want is not variable.importance ,,, i need var
 splits to be my outputTable ,, can i customize it?
Sorry, I'm not quite sure what the output is that you're looking for from the rpart object. Would either of these work for you?
library(rpart)
library(rpart.plot)

fit <- rpart(Mileage ~ Weight, car.test.frame)

fit["splits"]
#> $splits
#>        count ncat   improve  index adj
#> Weight    60    1 0.5953491 2567.5   0
#> Weight    45    1 0.5045118 3087.5   0
#> Weight    23    1 0.1476996 2747.5   0

rpart.plot::rpart.rules(fit)
#>  Mileage
#>       20 when Weight >=         3088
#>       24 when Weight is 2748 to 3088
#>       26 when Weight is 2568 to 2748
#>       31 when Weight <  2568
Created on 2018-12-04 by the reprex package (v0.2.1)
this is output i want
library(rpart)
library(rpart.plot)
library(broom)
library(broomstick)
fit <- rpart(Mileage ~ Weight, car.test.frame)
tidy(randomVals()$splits)
reprex()
the expected output is more or less the same as the one generated from the code you are doing, maybe a little more complete using tidy () from broomstick ... thank you very much for that ... maybe if I ask again ... how do I take the column 'improve' output only?
This topic was automatically closed 21 days after the last reply. New replies are no longer allowed.