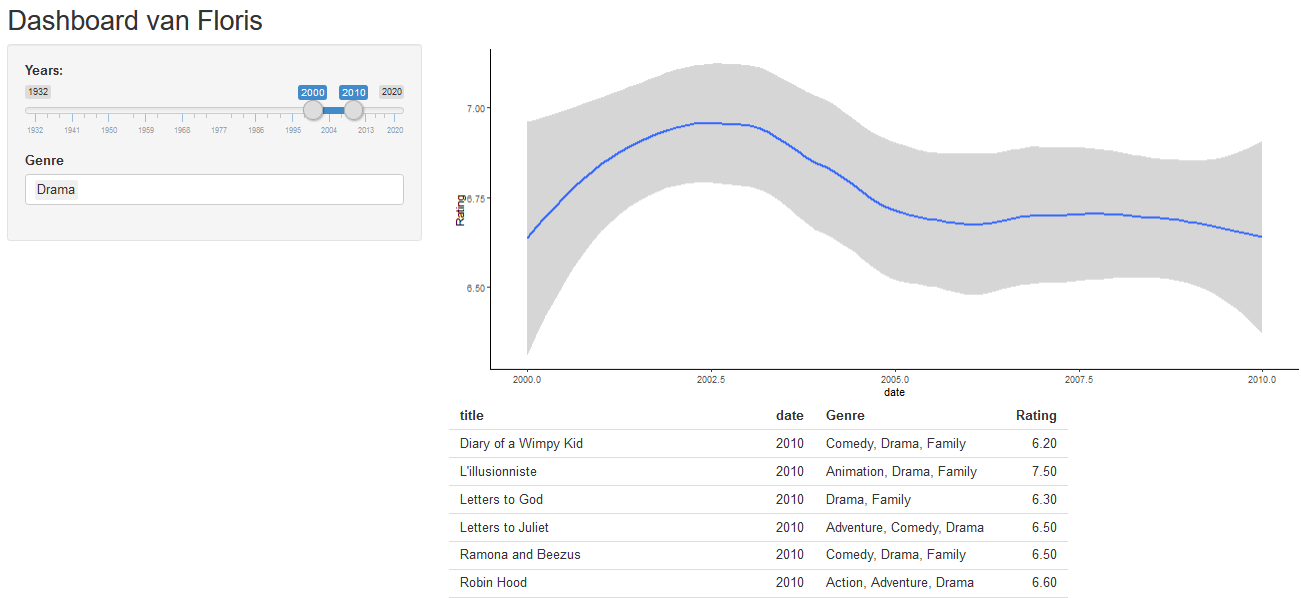
Hi for a school project I'm building shinydashboard in which i compare the GDP in America with the 'Best picture winning movies' on IMDB. I wanted to make a rangeInput where i can select a particular time segment. But now I only get what I select and whats above. Example: when I select 1973 is get everything from 1973 until 2015(That's the end of the dataset).
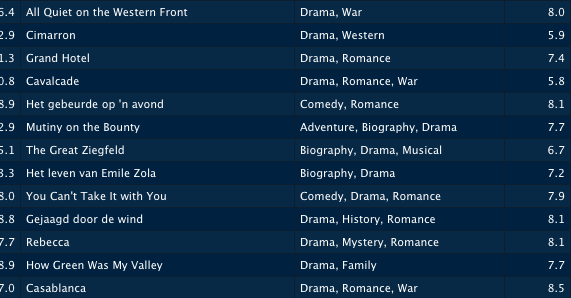
I also wanted to join a selectInput where it's possible to choose multiple Genres. In my dataset the multiple genres are in 1 column and i would like it to stay that way. But the filter doesn't work because it says it has to be a logical vector instead of a character.
Does anyone know how i can fix this?
library(shiny)
library(tidyverse)
library(readxl)

Dash <- read.csv("Dashboard_DS.csv")

ui<- fluidPage(
  titlePanel("Dashboard van Floris"),
  sidebarLayout(
    sidebarPanel(
      sliderInput("yearInput", "Years:", 1930,2015, value = 1976),
      selectInput("genreInput", "Genre", choices = c("Drama", "Crime", "History", "Thriller", "Comedy", "War", "Action",
                  "Musical", "Romance", "Western", "Sport", "Biography", "Family", "Music", "Film-noir", "Mystery"),
      selected = "Drama", multiple = TRUE)),
  mainPanel(
    plotOutput("Correlatie"),
    tableOutput("results")
  )
))

server<- function(input, output){

  output$results <- renderTable({
    filtered <-
      Dash %>%
      filter(date >= input$yearInput)%>%
      filter(Genre, grepl(input$genreInput, fixed = TRUE))
    filtered
  })
  output$Correlatie <- renderPlot({
    filtered <-
      Dash %>%
      filter(date >= input$yearInput)
    ggplot(filtered, aes(x = date, y = Rating,)) + geom_smooth()
  })

}

shinyApp(ui = ui, server = server)