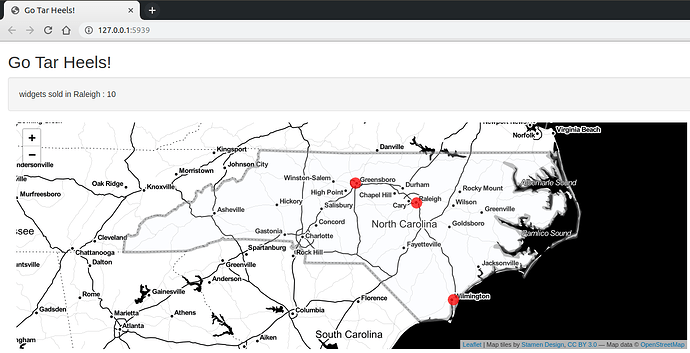
Well, if no public dataset is available - we will have to make do with our ingenuity, and the good ol' NC shapefile from {sf} package.
It's a bird? It's a plane! It's the North Carolina shapefile!!!
library(dplyr)
library(shiny)
library(leaflet)
library(sf)

# NC counties - a shapefile shipped with the sf package
shape <- st_read(system.file("shape/nc.shp", package ="sf")) %>%
    st_transform(shape, crs = 4326) %>%
    mutate(widgets = 300) %>% # a column of fake data
    group_by(widgets) %>%
    summarize()


# three cities - note the x and y coordinates
points <- data.frame(name = c("Raleigh", "Greensboro", "Wilmington"),
                     x = c(-78.633333, -79.819444, -77.912222),
                     y = c(35.766667, 36.08, 34.223333),
                     widgets = c(10, 20, 30)) %>%
    st_as_sf(coords = c("x", "y"), crs = 4326)


# create unique ids for both data sets

shape$uid <- "P1"
points$uid <- paste0("M", 1:3)


# Define UI
ui <- fluidPage(

    # Application title
    titlePanel("Go Tar Heels!"),


    verticalLayout(
        # Top panel with widgets sold
        wellPanel(
            textOutput("widgets")
        ),

        # the map itself
        mainPanel(
            leafletOutput("map")
        )
    )
)

# Define server logic
server <- function(input, output) {

    output$map <- renderLeaflet({

        leaflet() %>%
            addProviderTiles("Stamen.Toner") %>%
            addPolygons(data = shape,
                        fillColor = "aliceblue",
                        color = "grey",
                        layerId = ~uid) %>%  # unique id for polygons
            addCircleMarkers(data = points,
                             fillColor = "red",
                             color = NA,
                             radius = 10,
                             fillOpacity = .75,
                             layerId = ~uid)  # unique id for points
    })

    # click on polygon
    observe({

        event <- input$map_shape_click

        message <- paste("widgets sold in North Carolina:", shape$widgets[shape$uid == event$id])

        output$widgets <- renderText(message)


    })
    # click on a marker
    observe({

        event <- input$map_marker_click

        message <- paste("widgets sold in", points$name[points$uid == event$id],":", points$widgets[points$uid == event$id])

        output$widgets <- renderText(message)


    })
}

# Run the application
shinyApp(ui = ui, server = server)
Note that since the observed events for a polygon clicked and a marker clicked are separate (which I did not fully realize when writing my earlier post) is is not strictly necessary to do a fancy compounding of layer_id's.
