This code below may be too complex for anyone to want to delve into, but my main problem is:
- user inputs data in a shiny app textarea box
- data is processed with R code
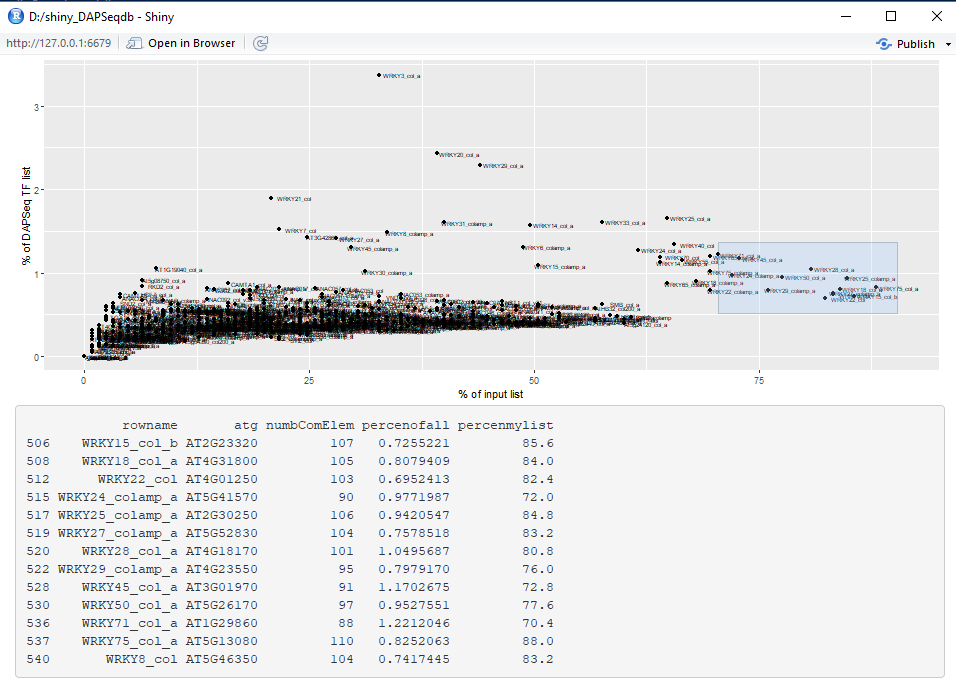
- processed data is used to create a scatterplot in which brushing provides a table of brushed points.
I have tried many things like rearranging the code in various ways. Using eventReactive and observeEvent to delay or trigger some code, but after many attempts nothing seems to work and I am beginning to wonder if the above three steps are possible with shiny because I can get it to work if I pre-enter what the user is supposed to enter, but now when the user enters the data and clicks the event button, nothing happens.
The code connects to an SQLite database that is 61MB which I can upload if anyone is interested. Without the database the code will not work, but perhaps someone can see a logical error in the way I have written the code and that or any suggestions would be very helpful.
library(shiny)
library(ggplot2)
library(stringr)
library(DBI)
library(dplyr)
library(RSQLite)
library(tibble)
library(ggraph)
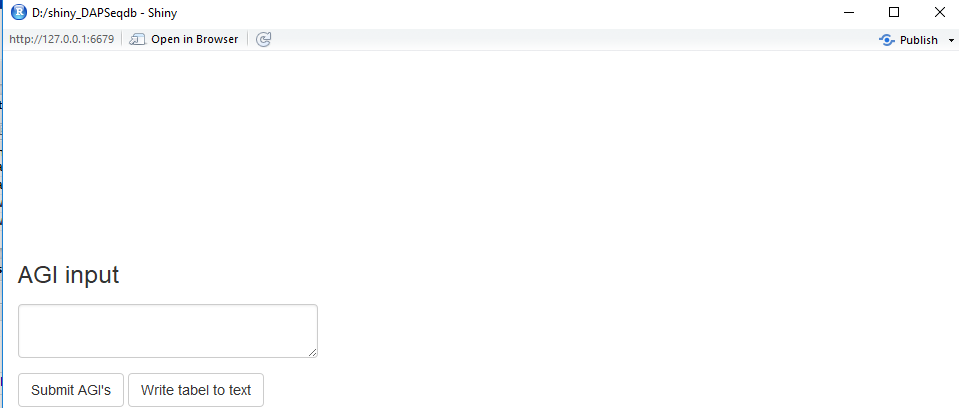
ui <- fluidPage(plotOutput("plot1", height = 450, brush = "plot_brush"), verbatimTextOutput("brush_info"),
textAreaInput("text", label = h3("AGI input"), value = ""),
actionButton(inputId = "addAGIs", label = "Submit AGI's"),
actionButton(inputId = "writetable", "Write tabel to text"))
# The above code does 2 things:
# 1) save space for plot1 with ability to brush points on plot (first line of code)
# 2) put a textarea box for input of AGI list (one AGI string per line). (second line of code)
# example of inputted text in the textarea box:
# AT4G31950
# AT5G24110
# AT1G26380
# AT1G05675
server <- function(input, output) {
common <- list(); # declare 5 lists that will be used in the below for loop.
percnt <- list();
comatgs <- list();
mylpercen <- list();
atgs <- list();
observeEvent(input$addAGIs, {output$value <- renderText({ input$text ;
myenter <- as.vector(str_split(input$text, "\n", simplify = TRUE))
})
})
# Upon clicking the "Submit AGI's" button, the above code renders text inputted in textarea input box (the list of AGIs such as in example above), and in the next line of code makes a vector of the inputted text for later use in this app. It would take the above example of inputted text and return : "AT4G31950" "AT5G24110" "AT1G26380" "AT1G05675"
data <- eventReactive(input$addAGIs, {
# The code down to output$plot1 seems to work by itself (taken out of this context).
# This code depends on having the 'myenter' vector which comes from data entered by the user in the textarea box, so I have put it in 'eventReactive' so that the user can enter the AGI list and this code will not be processed until after the 'myenter' vector has been made.
# It connects with an SQLite database (61MB size). The database is composed of 575 tables. Each table can be thought of as having a single column (field) with a column header. The column contains AGI identifiers (e.g. AT1G89790, similar to what is inputted in the textarea box), but of various lengths, say anywhere between 50 to 3000 AGI's (rows) in a particular table. The code intersects the inputted list of AGIs (specifically, the vector 'myenter') with the database table. It then calculates the percentage of the inputted list that intersected (i.e. AGI's common to both input and database table) as well as the percentage of the table that was common. It does this for each of the 500 or so tables in the SQLite database and then makes a dataframe (mydf), e.g. str(mydf) would give you something like this:
#'data.frame': 575 obs. of 4 variables:
# $ atg : Factor w/ 394 levels "AT1G45249","AT2G36270",..: 1 2 2 3 3 4 5 6 6 7 ...
#$ numbComElem : int 1 5 5 5 11 2 11 1 1 5 ...
#$ percenofall : num 0.0473 0.1194 0.1301 0.2272 0.1436 ...
#$ percenmylist: num 5 25 25 25 55 10 55 5 5 25 ...
# mydf2 simply adds rownames to the above mydf, and is present in the code most likely do to my poor R coding skills. mydf2 looks like this:
#str(mydf2)
#'data.frame': 575 obs. of 5 variables:
# $ rowname : chr "ABF2_col_v3a" "ABI5_col_v3h" "ABI5_colamp_v3b" "ABR1_col_a" ...
#$ atg : Factor w/ 394 levels "AT1G45249","AT2G36270",..: 1 2 2 3 3 4 5 6 6 7 ...
#$ numbComElem : int 1 5 5 5 11 2 11 1 1 5 ...
#$ percenofall : num 0.0473 0.1194 0.1301 0.2272 0.1436 ...
#$ percenmylist: num 5 25 25 25 55 10 55 5 5 25 ...
con <- dbConnect(RSQLite::SQLite(), dbname="DAPSeq_genes.db")
listOfTables <- dbListTables(con)
for(i in listOfTables){p1 = tbl(con, i)
dd <- as.data.frame(p1)
atgs[[i]] <- dbListFields(con, i)
z <- nrow(dd)
y <- intersect(dd[,1], myenter)
myll <- length(myenter)
comatgs[[i]] <- intersect(dd[,1], myenter)
x <- length(y)
pcent <- (x / z) * 100
common[[i]] <- x
percnt[[i]]<- pcent;
mylpcen <- ((x / myll) * 100)
mylpercen[[i]] <- mylpcen }
mydf <- do.call(rbind, Map(data.frame, atg=atgs, numbComElem=common, percenofall=percnt, percenmylist=mylpercen))
mydf2 <- rownames_to_column(mydf)
rownames_to_column(mydf) %>% arrange(desc(numbComElem)) %>% slice(1:50)
rownames_to_column(mydf) %>% arrange(desc(percenofall)) %>% slice(1:50)
}) # ends the eventReactive code block
output$plot1 <- renderPlot({
ggplot(data=mydf2, aes(x=percenmylist, y=percenofall)) + geom_point() + geom_text(label= mydf2$rowname, size = 2, nudge_x = 0.8, nudge_y = 0.05) + xlab("% of input list") + ylab("% of DAPSeq TF list")
})
# The code below outputs plot1 and allows for brushing of points.
# When points are bushed a table of brushed points appear below the plot.
xn <- NULL
output$brush_info <- renderPrint({x <<- brushedPoints(mydf2, input$plot_brush, xvar = "percenmylist", yvar = "percenofall")
})
# The code below will print out the table when the "writetable" button is clicked. The table is printed to a tab-delimited text file named MySelection.txt.
observeEvent(input$addAGIs, {write.table(x, file = "MySelectipon.txt", sep = "\t", row.names = FALSE, col.names = TRUE)})
xn
}
shinyApp(ui, server)