Hello all,
I am currently trying to make a Shiny App to visualize data in a leaflet plot. I let the user choose a dataset, which is inputted as a csv (so data frame), and then let them choose a column to plot. However, when I change the desired column, the plot doesn't change. Here is my code:
app.R:
rm(list = ls())
setwd("/this/is/a/file/path")
library(shiny)
library(leaflet)
library(sf)

source("ohio-ui.R")
source("ohio-server.R")

shinyApp(ui = ui, server = server) # Run app
ui.R:
ui <- fluidPage(
  title = "OH PA Datasets",
  titlePanel("Visualizing Ohio and Pennsylvania Datasets"),
  sidebarPanel(
    selectInput("datasetname", "Select dataset:",
                list.files(paste(getwd(), "/data-oh", sep = "")) # List of datasets
                ),
  ),
  mainPanel(
    uiOutput("datasetcolumn2"), # Dropdown to select data to plot from dataset
    leafletOutput("map_oh")
  )
)
server.R:
server <- function(input, output, session) {

  # Allow user to choose column of dataset
  output$datasetcolumn2 <- renderUI({
    chosen_dataset <- read.csv(paste("data-oh/", input$datasetname, sep = ""))
    selectInput("datasetcolumn", "Data choice:",
                # Only allow user to plot numerical data
                Filter(function(x) class(chosen_dataset[,match(x, names(chosen_dataset))])=="numeric",
                       names(chosen_dataset))
    )
  })


  # Map output for Ohio
  output$map_oh <- renderPlot({
    # Shapefile of all counties in USA
    shapefile <- st_read("us-county-boundaries/us-county-boundaries.shp")
    shapefile_oh <- shapefile[which(shapefile$state_name == "Ohio"),]

    chosen_dataset_oh <- read.csv(paste("data-oh/", input$datasetname, sep = ""))

    chosen_column <- input$datasetcolumn
    chosen_index <- match(chosen_column, names(chosen_dataset_oh))

    # Merge shapefile with desired data
    leaflet_oh <- merge(x = shapefile_oh,
                        y = chosen_dataset_oh[,c(6,chosen_index)],
                        by.x = "geoid", by.y = "FIPS",
                        all.x = TRUE)

    pal <- colorNumeric(palette = "Blues", domain = chosen_dataset_oh[,chosen_index])

    names(leaflet_oh)[21] <- "X"
    output$map_oh <- renderLeaflet({
      leaflet() %>%
        addTiles() %>%
        addPolygons(data = leaflet_oh,
                    stroke = FALSE,
                    smoothFactor = 0.2,
                    fillOpacity = 1,
                    color = ~pal(X),
                    label = ~paste0(namelsad, "=", X)
        )
    })
  })
}
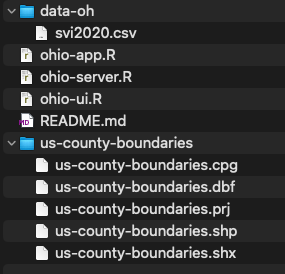
The structure of my files is this:

The datasets I used are at CDC/ATSDR Social Vulnerability Index (SVI) , for the state of Ohio, in 2020, at the county level.
The shapefile I used is at US County Boundaries — Opendatasoft .