Has anyone tried to link polygons plotted into interactive leaflet map with a plotly graphs? Or with plot_mapbox() for that matter? Essentially I am looking for a reversal of this example http://rpubs.com/rcatlord/gapminder_crosstalk_updated . Instead of clicking on graph which will filter the map, I would like to click on the map polygon which would return all the entries for the area of the polygon (not just individual spots like plotting markers) => and graphs for them. Not sure whether it can be done without much hassle.
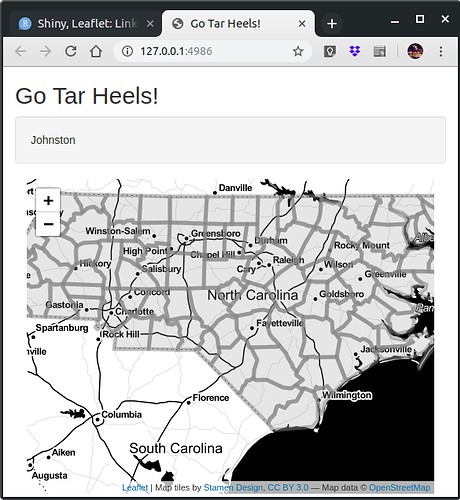
The Leaflet part is not difficult - you need to have an unique id for your polygons, and assign it to layerId in your addPolygons leaflet call.
This polygon id is then returned in the id field of your input$map_shape_click event & can be used for all sorts of reactive fun.
In this toy example built upon the well known & well loved North Carolina shapefile the observed click on a polygon is used to filter the vector of county names for display in the top panel, but the possibilities do not end there...
library(shiny)
library(leaflet)
library(sf)

# NC counties - a shapefile shipped with the sf package
shape <- sf::st_read(system.file("shape/nc.shp",
                                 package ="sf"),
                     stringsAsFactors = F)


# Define UI
ui <- fluidPage(

    # Application title
    titlePanel("Go Tar Heels!"),

    # Top panel with county name
    verticalLayout(

        wellPanel(textOutput("cnty")),

        # the map itself
        mainPanel(
           leafletOutput("map")
        )
    )
)

# Define server logic
server <- function(input, output) {

    output$map <- renderLeaflet({
        leaflet() %>%
            addProviderTiles("Stamen.Toner") %>%
            addPolygons(data = shape,
                        fillColor = "aliceblue",
                        color = "grey",
                        layerId = ~CNTY_ID)
    })

    # this is the fun part!!! :)
    observe({
        event <- input$map_shape_click
        output$cnty <- renderText(shape$NAME[shape$CNTY_ID == event$id])

    })
}

# Run the application
shinyApp(ui = ui, server = server)
2 Likes
Thank you very much! This solves the problem & is simpler and more elegant than what I had in mind.
Glad to be of service!
1 Like
This topic was automatically closed 7 days after the last reply. New replies are no longer allowed.
