(Under my code for reprex)
Shiny Graphic disappears when i switch from a tabPanel to another
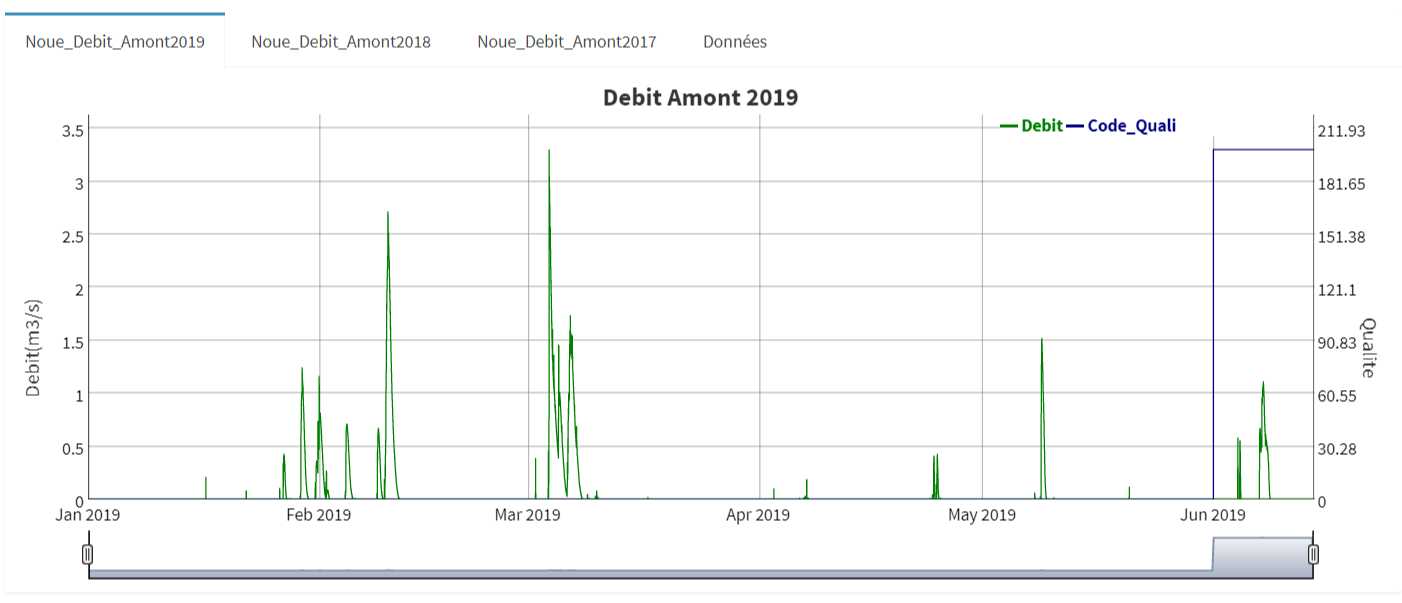
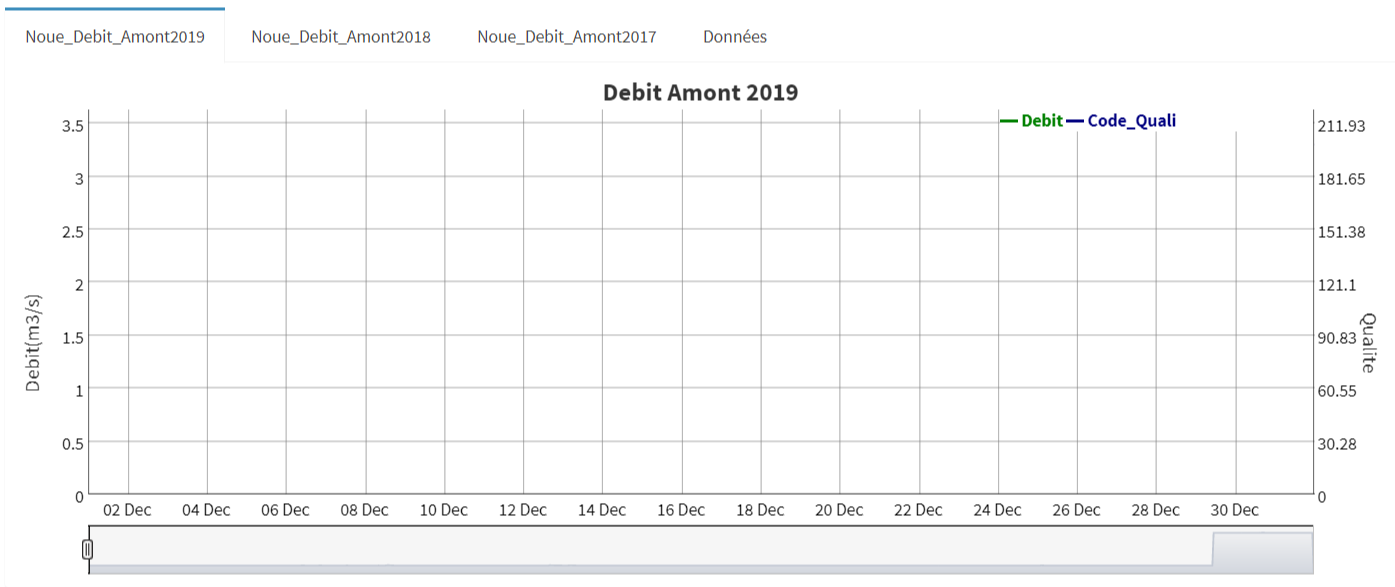
I get this problem when i plot many dygraphs in shinydashbord tabPanel. I have an app with many tabPanel with a shiny graph on each of them. When the app is lunch every graph are correctly plot when i switch for a first time from a tabPanel to another. But when i come back to a graph on a tabPanel previously load : graph disappears. Before (tab1 and tab2):
After :
You can download the data here
borja_id_temp_2019
borja_id_temp_2018
library(shiny)
library(shinydashboard)
library(dygraphs)

borja_id_temp_2019 <-readRDS(file="Noue_Dumont_Amont_Debit_2019_ord.rds")
borja_id_temp_2018 <-readRDS(file="Noue_Dumont_Amont_Debit_2018_ord.rds")

dygrph_noue_amont_2019<- dygraph(borja_id_temp_2019, main = "Debit Amont 2019", group = "Debit Amont Noue")%>% dyAxis("y", label = "Debit(m3/s)") %>% dyAxis("y2", label = "Qualite")%>%  dySeries("Debit", axis = 'y')%>%dySeries("Code_Quali", axis = 'y2')%>% dyRangeSelector()
dygrph_noue_amont_2018<-dygraph(borja_id_temp_2018, main = "Debit Amont 2018", group = "Debit Amont Noue")%>% dyAxis("y", label = "Debit(m3/s)") %>% dyAxis("y2", label = "Qualite")%>%  dySeries("Debit", axis = 'y')%>%dySeries("Code_Quali", axis = 'y2')%>% dyRangeSelector()

ui <- dashboardPage(


  dashboardHeader(title = 'Reporting Dashboard'),

  dashboardSidebar(
    width = 350,
    sidebarMenu(
      menuItem("Site 1: Noue Dumont", tabName = "dumont", icon = icon("dashboard"))

    )),


  dashboardBody

  (
    tabItems(
      tabItem(

        tabName = "dumont",
        h2("Noue centralisée Standard de Nantes/Site Dumont"),

        box( width=NULL,
             title = "Debit Amont", status = "info", solidHeader = TRUE,
             collapsible = TRUE,collapsed = TRUE,

             tabBox(width=NULL,

                    tabPanel("Noue_Debit_Amont2019",

                             dygraphOutput("dydebiamont2019",width = "100%")
                    ),
                    tabPanel("Noue_Debit_Amont2018",
                             dygraphOutput("dydebiamont2018",width = "100%")
                    )
             )
        )
      )

    )
  ))


  #fin du dashboardHeader


  server <- function(input, output)
  {

    output$dydebiamont2019 <- renderDygraph({
      dygrph_noue_amont_2019
    })
    output$dydebiamont2018 <- renderDygraph({
      dygrph_noue_amont_2018
    })
  }

  shinyApp(ui, server)