Shiny displaying datatable with filter option for each column

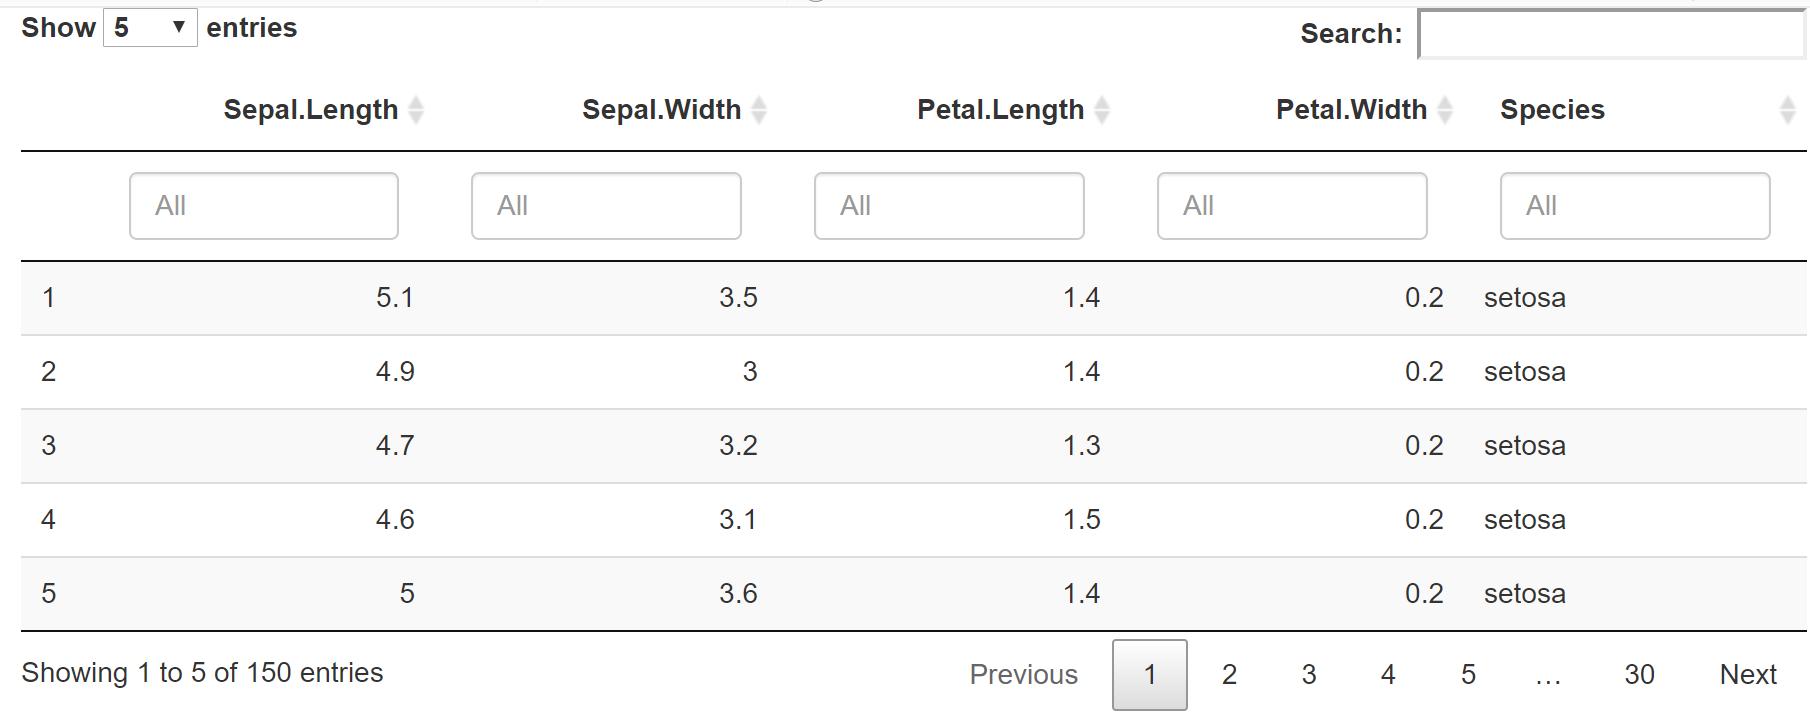
How can we display filter options within shiny as shown in R below:
https://rstudio.github.io/DT/008-filter.html

shinyApp(
  ui = fluidPage(
    fluidRow(
      column(12,
             dataTableOutput('table')
      )
    )
  ),
  server = function(input, output) {
    output$table <- renderDataTable(iris,
                                    options = list(
                                      pageLength = 5,
                                      initComplete = I("function(settings, json) {alert('Done.');}")
                                    )
    )
  }
)

Tried both ways providing filter as an argument but did not produce filter option

    output$table <- renderDataTable(iris,
                                    filter = "top",
                                    options = list(
                                      pageLength = 5,
                                      initComplete = I("function(settings, json) {alert('Done.');}")
                                    )

    output$table <- renderDataTable(iris,
                                    options = list(
                                      pageLength = 5,
                                      list(autoWidth = TRUE), filter = list(
                                        position = 'top'
                                    ))
    )
1 Like

Use DT::renderDT() instead

library(shiny)
library(DT)
shinyApp(
    ui = fluidPage(
        fluidRow(
            column(12,
                   DTOutput('table')
            )
        )
    ),
    server = function(input, output) {
        output$table <- renderDT(iris,
                                 filter = "top",
                                 options = list(
                                     pageLength = 5
                                 )
        )
    }
)

3 Likes

This topic was automatically closed 7 days after the last reply. New replies are no longer allowed.