...I'm fairly new on here so hopefully I put this in the right way.
I'm trying to run a ggplot in a shiny dashboard app based on variables input from a user using a SelectInput field but can't seem to get it to work. Any suggestions
library(shiny)
library(shinydashboard)
library(ggplot2)
library(DT)
library(tidyverse)
header <- dashboardHeader(title = "Customer Acquisition compared to Customer Retention")
sidebar <- dashboardSidebar(
sidebarMenu(
menuItem("Marketing", tabName = "Marketing", icon = icon("dashboard"))
))
body <- dashboardBody(
tabItems(
tabItem(tabName = "Marketing",
h3("Annual Marketing Costs"),
fluidRow(
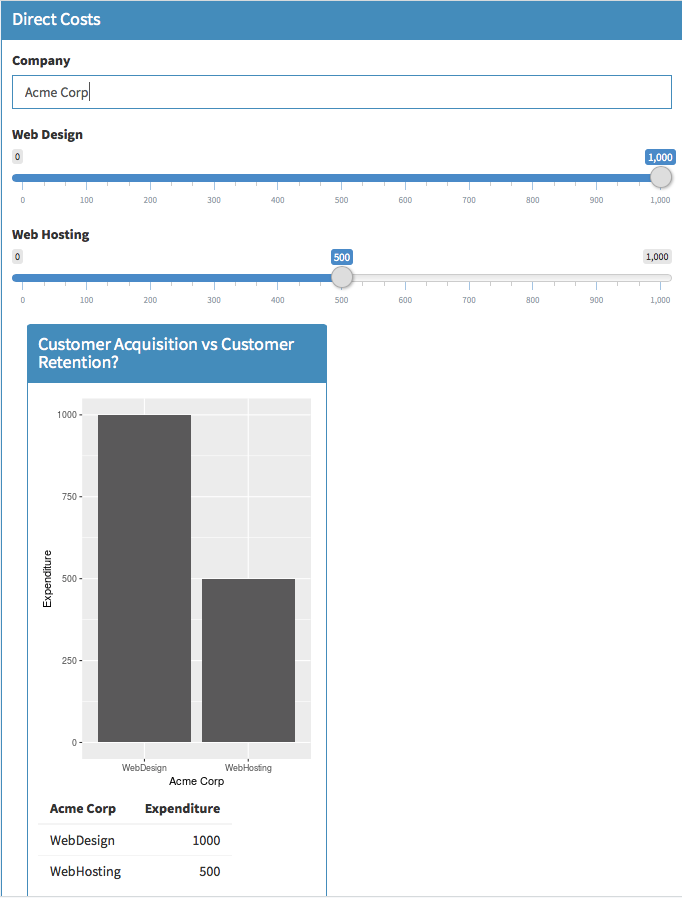
box(title = "Direct Costs", solidHeader = TRUE, status = "primary",
textInput("company", "Company", "Company Name"),
sliderInput("wd", "Web Design", min=0, max =1000, 3000, round=TRUE),
sliderInput("wh", "Web Hosting", min=0, max =1000,500, round=TRUE),
box(title = "Customer Acquisition vs Customer Retention? ", solidHeader = TRUE, status = "primary",
plotOutput("plot"),
tableOutput("data")))))))
ui <- dashboardPage(skin="blue",
header,
sidebar,
body
)
server <- function(input, output) {
#text name
output$company <- renderText({ input$company })
sum <- reactive({
input$wd + input$wh
})
output$data <- renderTable({
df <- data.frame(Company = input$company, WebDesign = input$wd,WebHosting = input$wh) %>%
gather("Company", "WebDesign:WebHosting") %>%
rename("Expenditure" = "WebDesign:WebHosting")
})
output$plot <- renderPlot({
ggplot(df(),aes_string(factor(input$Company), input$Expenditure)) +
geom_col()
})
}
# Run the application
shinyApp(ui = ui, server = server)
 to your code? We ask posters here to do this in order to make the site easier to read and to prevent confusion (unformatted code can mistakenly trigger other types of automatic formatting, such as turning all your comments into headers!
  ). You can read all the details of how to do it here:
  : select any code (whether in blocks or in bits and pieces mixed into your sentences) and click the little
 I know the feeling of going in code circles for hours
  — glad to have helped you escape!