library(RODBC)
library(RODBCext)
library(plotly)
library(shinydashboard)
library(shiny.semantic)
library(shiny)
dbcnd <- odbcDriverConnect('Driver={SQL Server};Server=;Database=;Uid=;Pwd=')
ui <- fluidPage(
plotlyOutput("boxplot1"),
plotlyOutput("boxplot2"),
plotlyOutput("boxplot3")
server <-function(input, output, session) {
output$boxplot1 <- renderPlotly({
qrydd=paste("exec databasename..[srtored_procedure]'','96','','','0','01/01/2017','31/12/2017'")
qrydd
dtd <- sqlQuery(dbcnd,qrydd)
dtd <- data.frame(dtd)
dtd
ds <- data.frame(labels = c("totalraj","totalother"),
                 values = c(dtd$totalraj,dtd$totalother)
)
closeAllConnections()

plot_ly(ds, labels = ~labels, values = ~values,type = 'pie')%>%
  layout(legend = list(orientation = "h",
                       xanchor = "left"))
})
output$boxplot2 <- renderPlotly({
qrydd=paste("exec databasename..[srtored_procedure] '0','0','','0','','01/01/2017','31/12/2017'")
qrydd
dtd <- sqlQuery(dbcnd,qrydd)
dtd <- data.frame(dtd)
dtd
closeAllConnections()
tablename=rowSums(cbind(dtd$totalraj,dtd$totalother),na.rm=TRUE)
layout <- list(
  font = list(size = 12),
  title = "",
  xaxis = list(title = ""),
  yaxis = list(title = " ",automargin = TRUE)
)

p <- plot_ly(dtd, colors = COL, marker = list(color = COL))
p <- add_trace(p, x = dtd$totalraj, y =~tablename,name = "",type = 'bar')
p <- layout(p, font = layout$font, title = layout$title, xaxis = layout$xaxis, yaxis = layout$yaxis)
})
output$boxplot3 <- renderPlotly({
qrydd=paste("exec databasename..[srtored_procedure]'0','0','','0','','01/01/2017','31/12/2017'")
qrydd
dtd <- sqlQuery(dbcnd,qrydd)
dtd <- data.frame(dtd)
dtd
closeAllConnections()

data <- data.frame(dtd$districtname, dtd$totalraj, dtd$totalother)

p <- plot_ly(data, x = dtd$DistrictName, y = dtd$totalother, type = 'bar', name = 'raj') %>%
  add_trace(y = dtd$totalother, name = 'other-state') %>%
  layout(yaxis = list(title = ''), barmode = 'group',bargroupgap="0.1")
})
}
shinyApp(ui,server)
i am using data as a stored procedure from sql server but you can use data here as a csv file to test the condition...
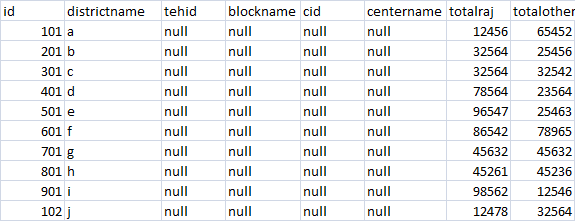
id districtname tehid blockname cid centername totalraj totalother
101 a null null null null 12456 65452
201 b null null null null 32564 25456
301 c null null null null 32564 32542
401 d null null null null 78564 23564
501 e null null null null 96547 25463
601 f null null null null 86542 78965
701 g null null null null 45632 45632
801 h null null null null 45261 45236
901 i null null null null 98562 12546
102 j null null null null 12478 32564