Disease Risk Mapping and Cluster Detection with SpatialEpiApp

shinyapps.io: https://paulamoraga.shinyapps.io/spatialepiapp/
RStudio Cloud: Posit Cloud
GitHub: GitHub - Paula-Moraga/SpatialEpiApp: SpatialEpiApp
SpatialEpiApp is a Shiny web application that allows to visualize spatial and spatio-temporal disease data, estimate disease risk, and detect clusters. The application incorporates modules for
-
Disease risk estimation using Bayesian hierarchical models with INLA;
-
Detection of clusters using the scan statistics implemented in SaTScan;
-
Interactive visualizations such as maps supporting padding and zooming and tables that allow for filtering;
-
Generation of reports containing the analyses performed.
SpatialEpiApp allows user interaction and creates interactive visualizations by using the R packages Leaflet for rendering maps, dygraphs for plotting time series, and DataTables for displaying data objects. It also enables the generation of reports containing the analyses performed by using RMarkdown.
SpatialEpiApp may be useful for many researchers and practitioners working in public health and lacking the adequate statistical and programming skills to effectively use the statistical software required to conduct the statistical analyses. With SpatialEpiApp, we simply need to upload the map and data and then click the buttons that create the input files required, execute the software and process the output to generate tables of values and plots with the results. Here we briefly describe the main components of the application. The package vignette can be checked for more details about its use, methods and examples.
Use of SpatialEpiApp
We can see how the application works here. We just need to select the 'Use sample data' option and click the 'Start analysis' button on the right to see an example of a spatio-temporal analysis of lung cancer mortality in Ohio, USA, in years 1981 to 1984. This just shows the visualization part. To estimate risk and detect clusters we need to install the R package SpatialEpiApp which contains the Shiny app. The development version from GitHub can be installed by using the install_github() function of the R package devtools:
library(devtools)
install_github("Paula-Moraga/SpatialEpiApp")
Then, we can launch the Shiny app by executing the following code:
library(SpatialEpiApp)
run_app()
The application consists of three pages: 'Inputs', 'Analysis' and 'Help'.
Inputs
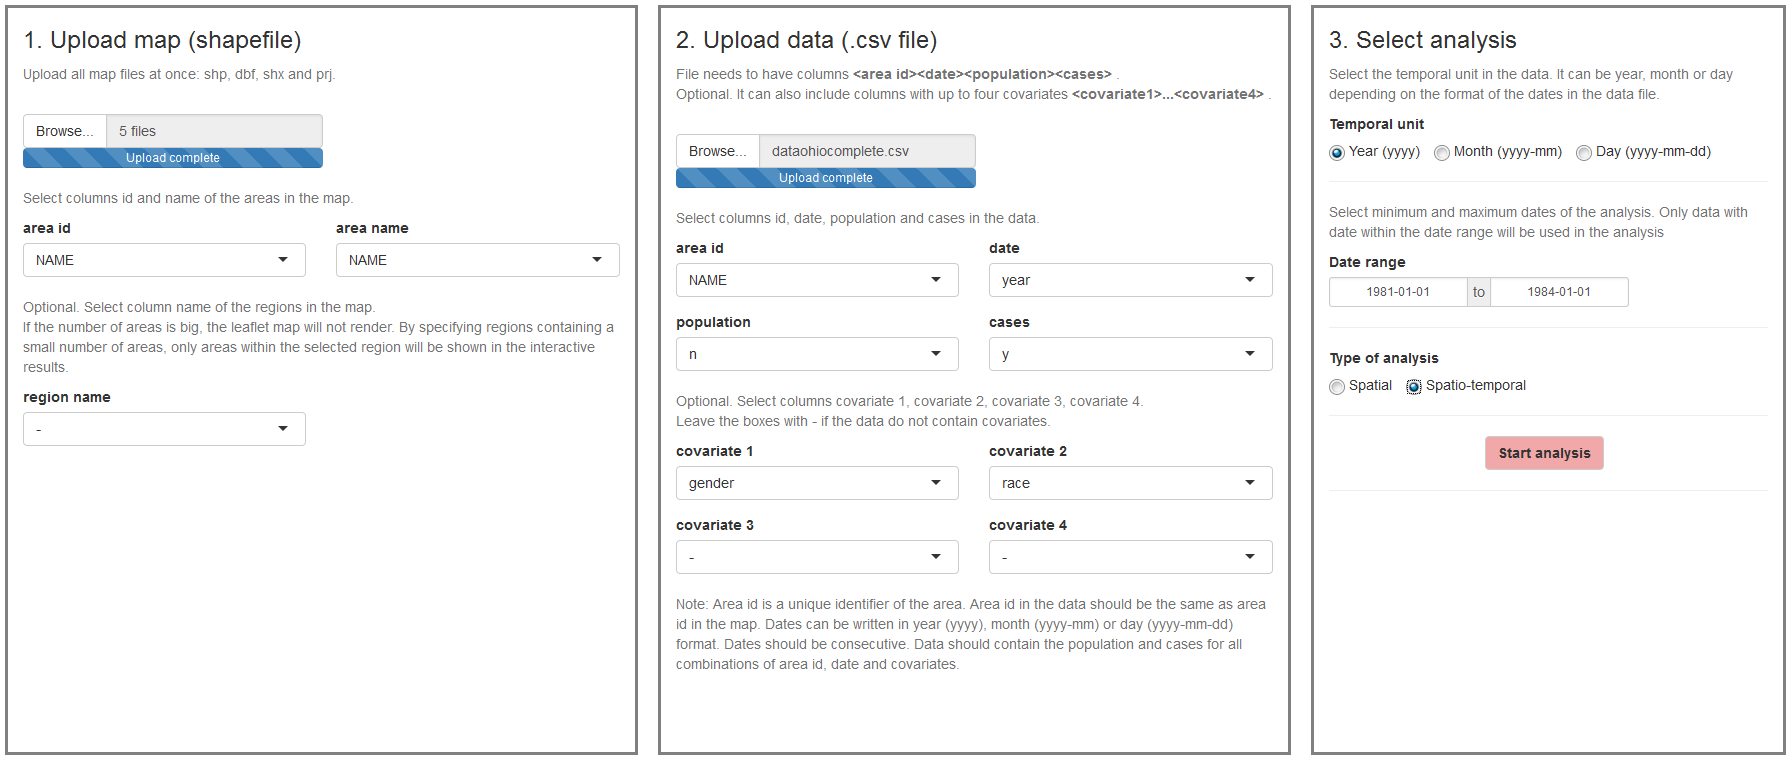
The 'Inputs' page is the first page we see when we launch the application. In this page we can upload the required files and select the type of analysis to be performed. It is composed of three components:
- Upload map (shapefile);
- Upload data (csv file with area id, date, population, cases and covariates);
- Select analysis (temporal unit, date range, spatial or spatio-temporal analysis).
Analysis
In the 'Analysis' page we can visualize the data, perform the statistical analyses, and generate reports. On the top of the page there are four buttons:
- 'Edit Inputs' is used when we wish to return to the 'Inputs' page to modify the analysis options or upload new data;
- 'Maps Pop O E SIR' creates plots of the population, observed, expected and SIR variables;
- 'Estimate risk' is used to estimate the disease risk and their uncertainty;
- 'Detect clusters' is used for the detection of disease clusters.
The 'Analysis' page also contains four tabs called 'Interactive', 'Maps', 'Clusters' and 'Report' that include tables and plots with the results.
Maps
The 'Maps' tab shows a summary table, maps and temporal trend plots of the population, observed cases, expected cases, SIR, risk and lower and upper limits of 95% credible intervals that were obtained by clicking the 'Map Pop O E SIR' and the 'Estimate risk' buttons.

Clusters
The 'Clusters tab' shows, for each of the dates of the period of study, a map with the clusters detected and a plot with all clusters over time. This tab also includes a table with the information relative to each of the clusters such as the areas included and the significance.

Report
In the 'Report tab' we can download a PDF document showing the results of our analysis. The report includes maps and tables summarizing the variables population, observed, expected, SIR, risk, lower and upper limits of the 95% credible intervals and clusters for each of the periods of time.

Help
Finally, the 'Help' button redirects to the 'Help' page which shows information about the use of the application, the statistiscal methodology and the developing tools employed.
Conclusion
I think SpatialEpiApp can be very useful for many researchers and practitioners working in public health.
Moreover, the application can be easily extended and in future versions I will increase its flexibility enabling more options for disease mapping and the detection of clusters, as well as custom data visualizations.
References
Moraga, P. (2017), SpatialEpiApp: A Shiny Web Application for the analysis of Spatial and Spatio-Temporal Disease Data. Spatial and Spatio-temporal Epidemiology, 23:47-57