Overview
This app is a collection of visualizations based on the Lego data available at Rebrickable. They address the question, "What is it like to live in the Lego world?" That is, what kinds of people do you meet? How are they feeling? What plants and animals do you find around you?
Think of each theme as an island on the Lego planet. Each visualization can be faceted by theme, so you can compare fashion, flora and fauna, etc. across themes.
The human focus of this app distinguishes it from the various other Lego visualizations that already exist (including one built in Shiny; see "About" in the app for a fuller list).
Lego parts are labeled and categorized using three main sources of information:
- The part category (e.g., "Minifig Heads" or "Plants and Animals") specified in the database
- The hexadecimal part color specified in the database
- Keywords in the part name
The keywords that map part names to categories involve more-or-less hand-curated lists and some very basic text processing (mostly regular expressions). The process is not 100% accurate; there are plenty of false positives and false negatives. But it's good enough for a first pass.
Links
- shinyapps: https://kaplanas.shinyapps.io/living_in_the_lego_world/
- RStudio Cloud: Posit Cloud
- GitHub: GitHub - kaplanas/Shiny-Lego: Shiny app to visualize a database of Lego sets
Highlights and Screenshots
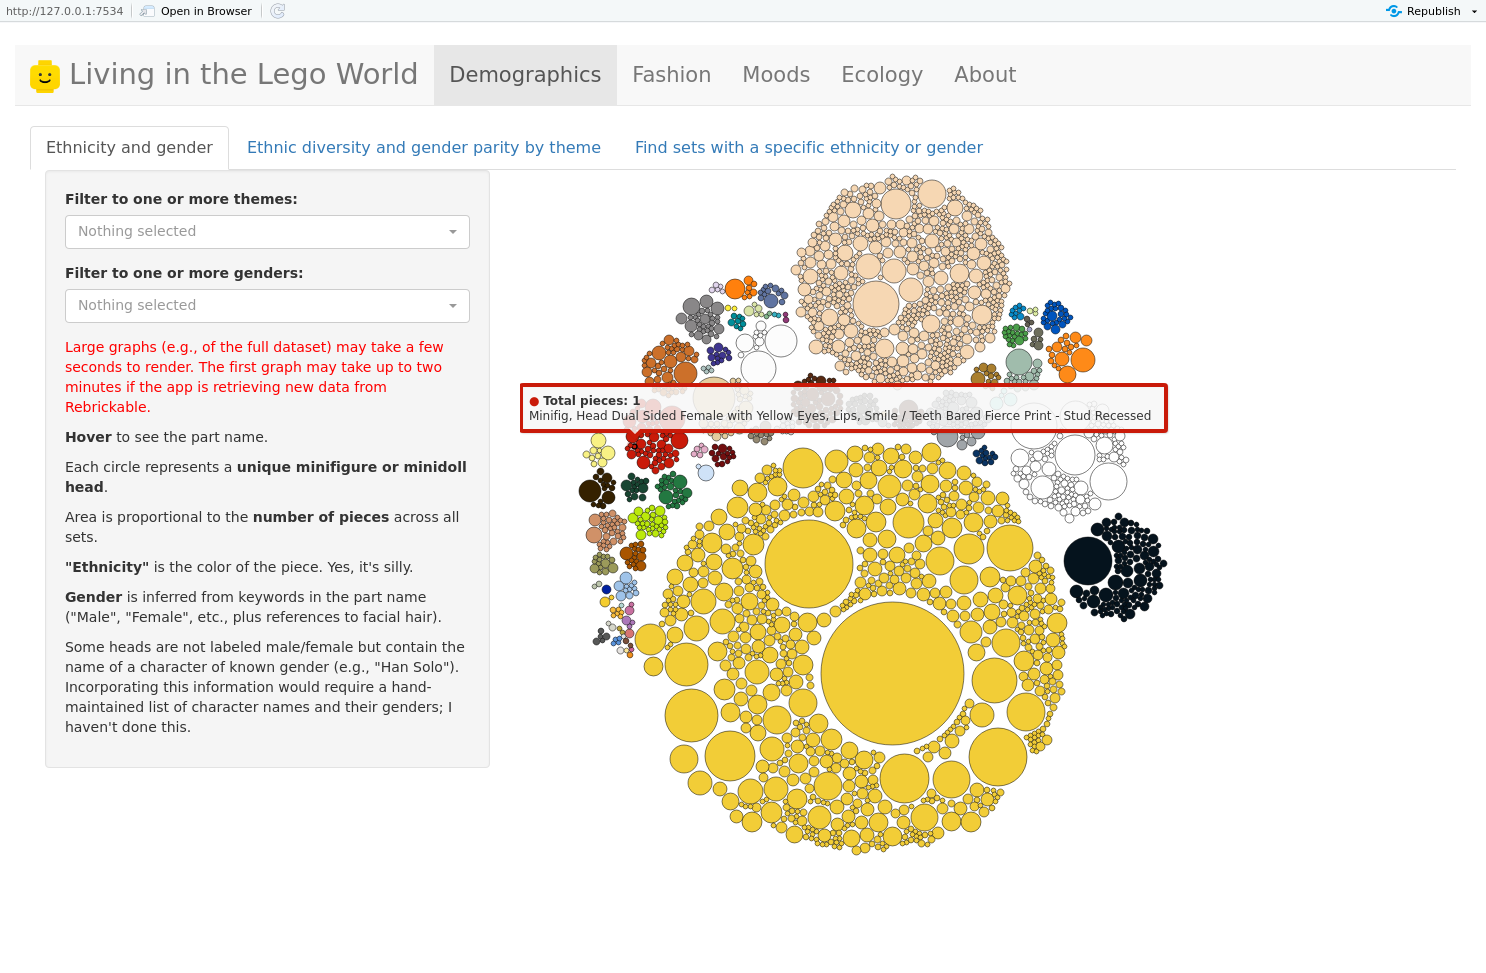
Demographics
Visualize the distribution of gender and "ethnicity" (color) with a circle-packing plot. Each circle is a Lego head; size represents the number of pieces across all sets.
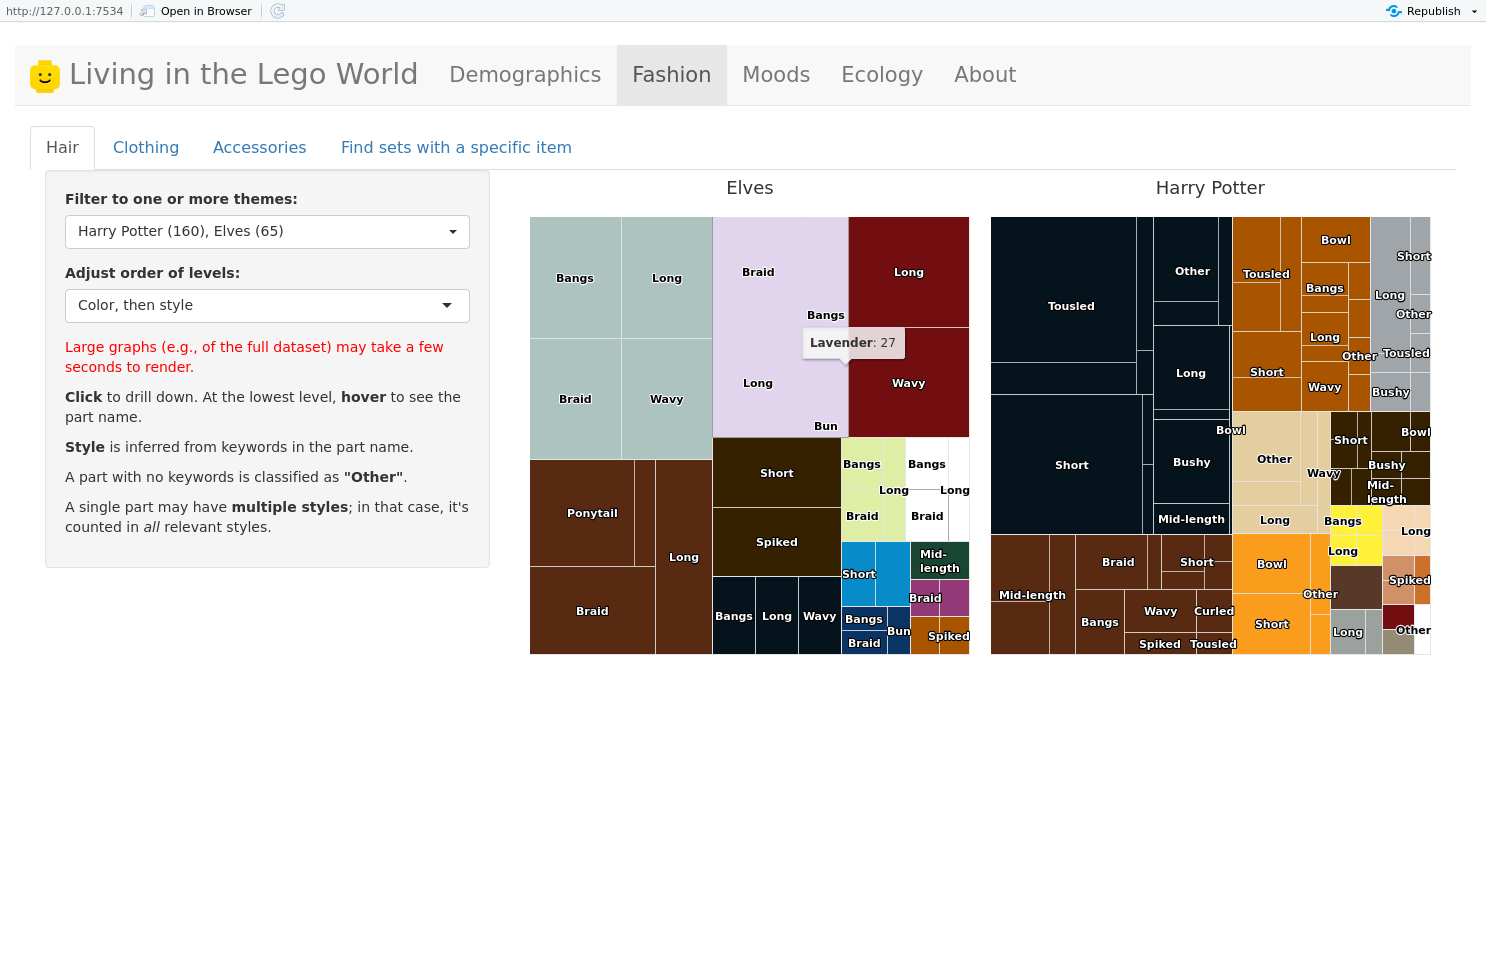
Fashion
Clickable treemaps of the type and color of hair, clothing, and accessories.
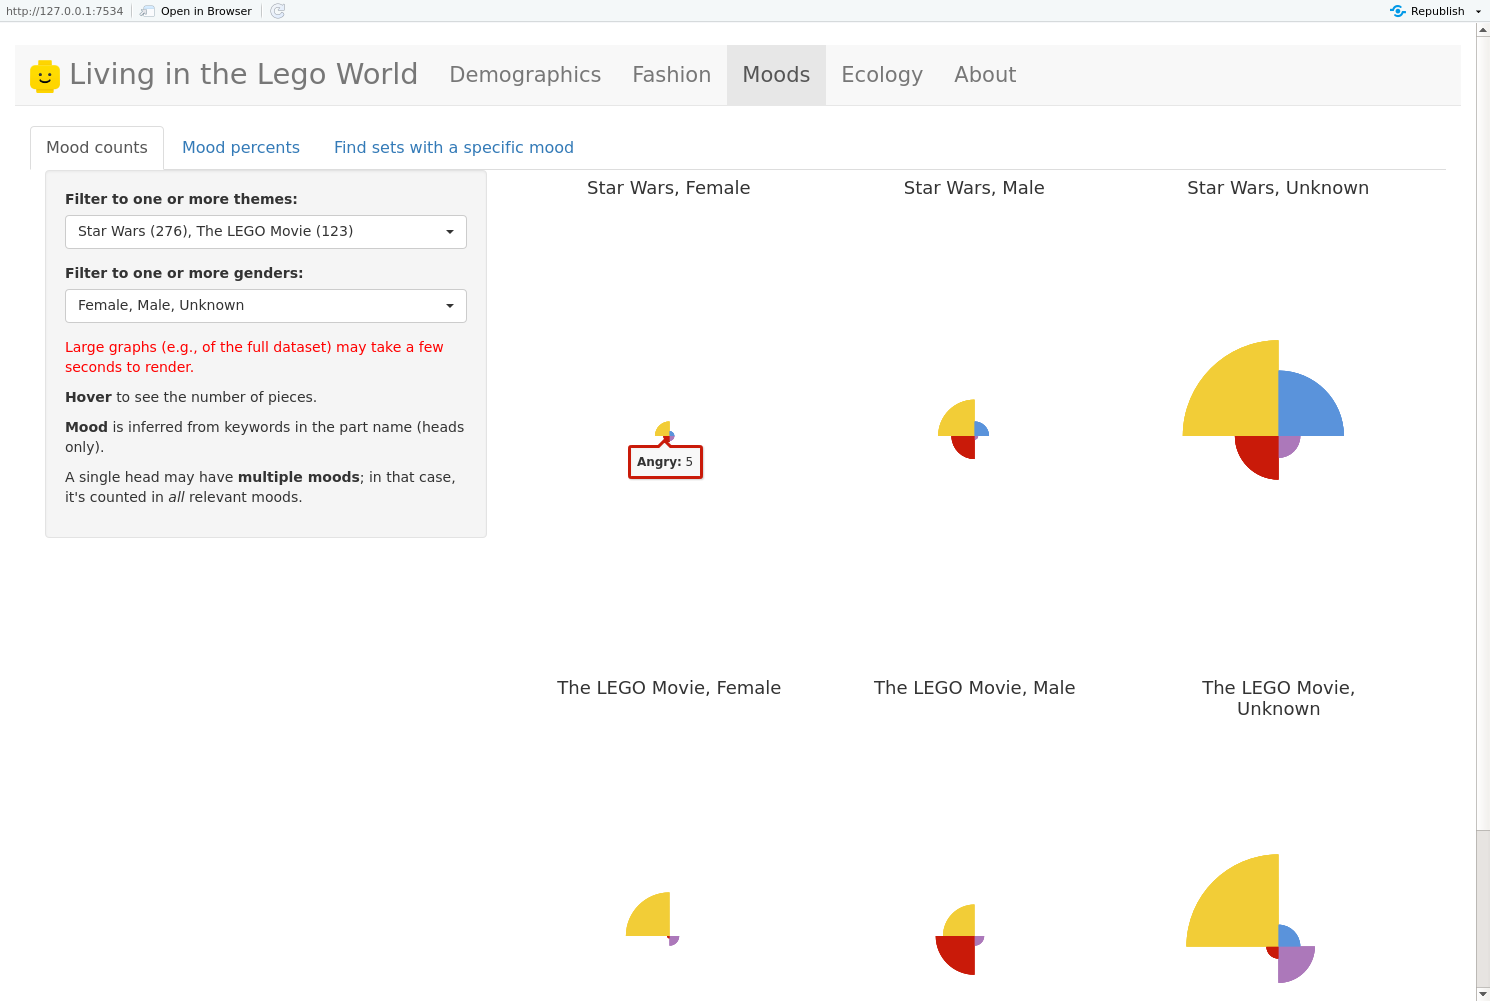
Moods
Polar plots of four basic emotions (happiness, sadness, anger, and fear) expressed on minifigure heads.
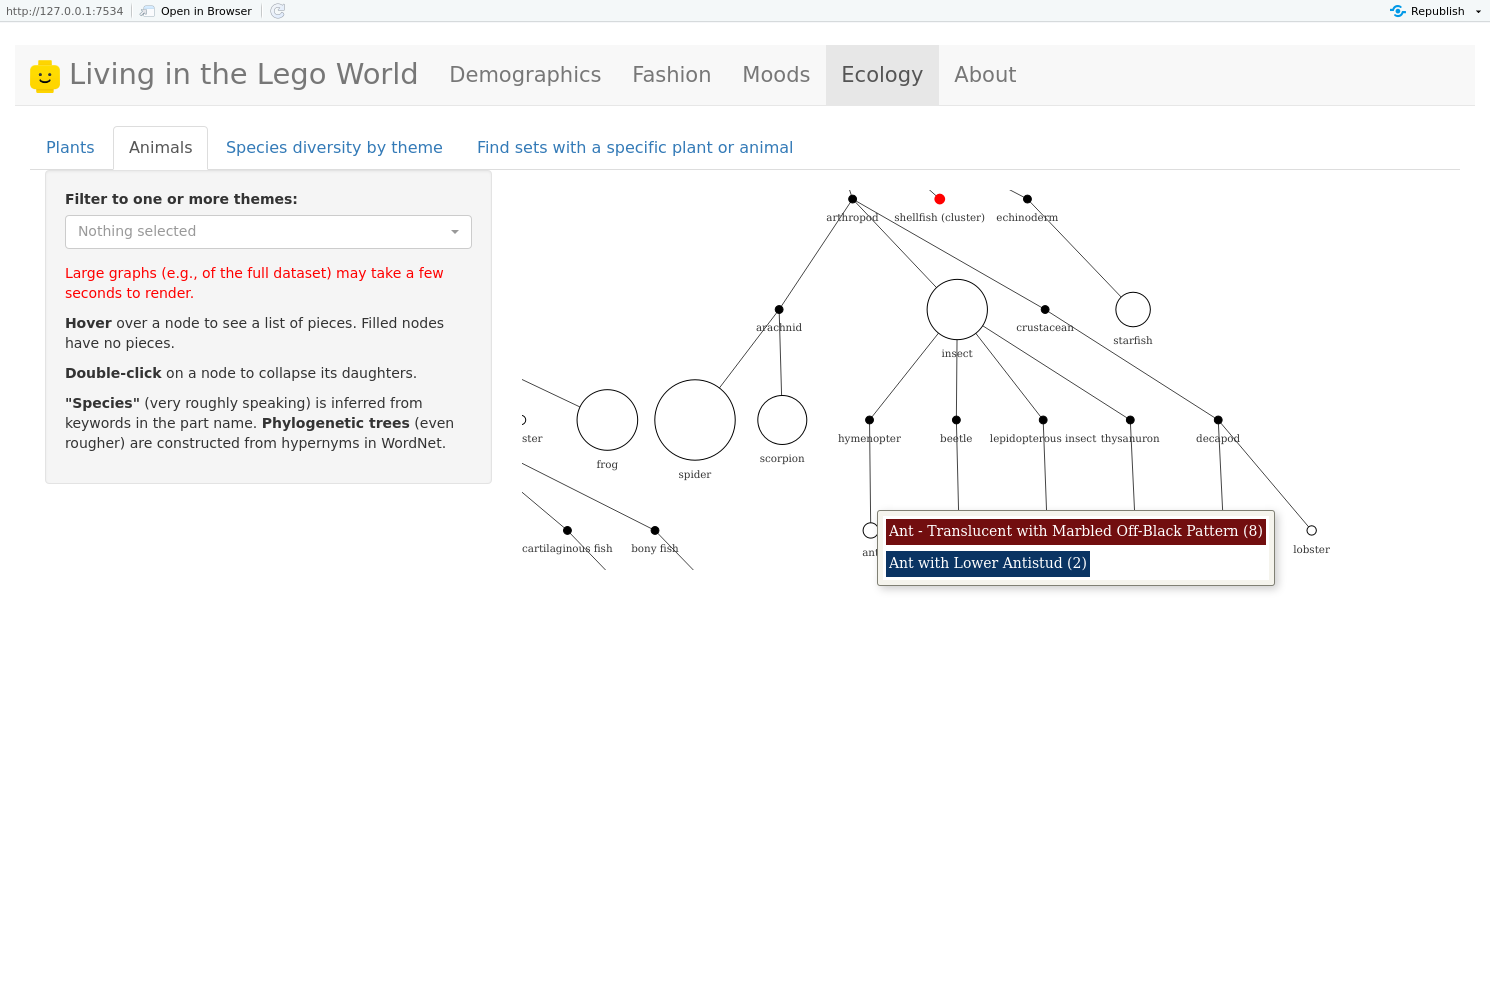
Ecology
Interactive dendrograms of plants and animals.