RStudio Cloud: Posit Cloud
Live shinyapp.io: https://appforiarteam.shinyapps.io/Interactive_charts_reports/
Github Repos: GitHub - jienagu/D3_folded_charts: This is a showcase of interactive charts in shiny and Rmarkdown reports
Demo gif:
This is a more advanced interactive charts with dynamic reports!
Note: this app used noteMD R package (Repos: GitHub - jienagu/noteMD: Print text from shiny ui (support markdown syntax) to pdf or word report) and nivopie (Repos: GitHub - jienagu/nivopie: An html widget that creates interactive pie chart) R package (htmlwidget) from my Github!
The design
-
Folded data structure:
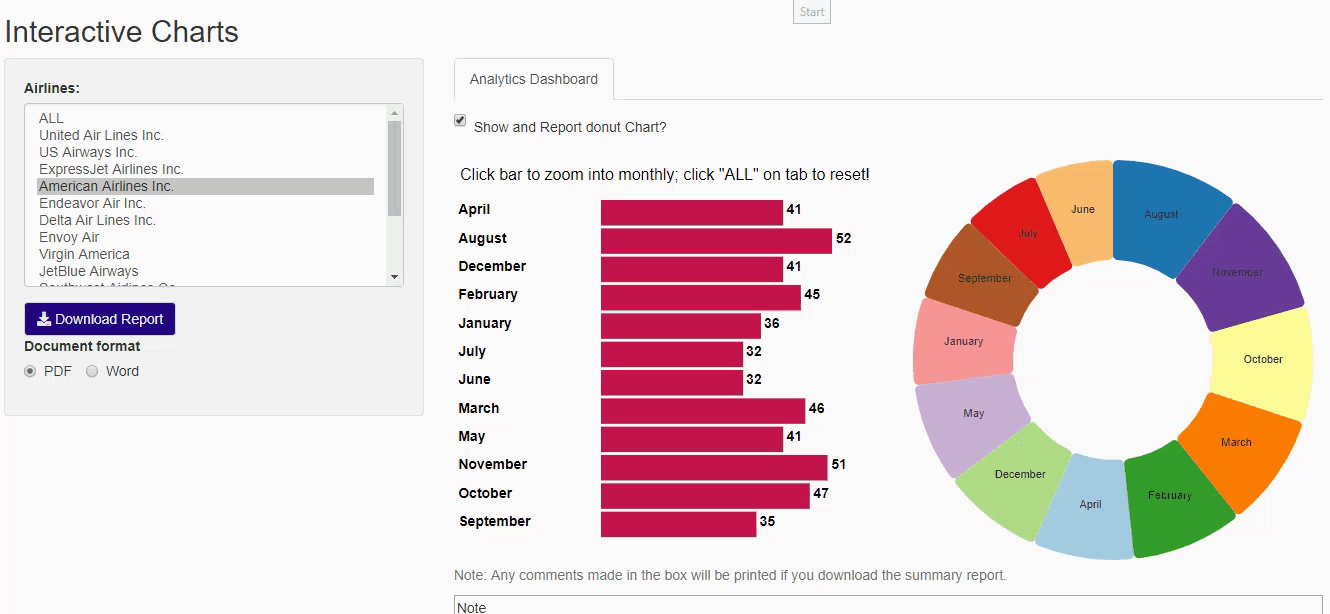
- zoom in to monthly chart by either clicking bar or the dropdown menu from slidebar. Click "ALL" from dropdown selector to reset! When zooming in monthly chart, both bar chart and donut chart are zoom into monthly level.
-
Customize charts show/hide
- Users can check/uncheck to decide whether they want to show the donut chart!
-
Customize charts in reports
- Users can check/uncheck to decide whether they want to print the donut chart in reports or not.
-
Custmize note
- Users can take notes under charts and their notes will be printed in the reports.
Acknowledgement
Beef Cattle Institute from Kansas State University
