This submission is a dashboard for visualising personal Facebook use recorded with the ROSE web browser extension for Google Chrome and Safari.
The ROSE extension is developed by people at the Fraunhofer Institute for Secure Information Technology, Darmstadt, Germany and is a privacy-preserving tool for people to record the overall structure of their use of Facebook, while storing the data only locally on their laptops.
The ROSE extension lets people export their data as a .txt file, and the dashboard I am submitting to the competition allows people to create visualisations of this data file.
The front page gives a quick explanation of how to use the dashboard.
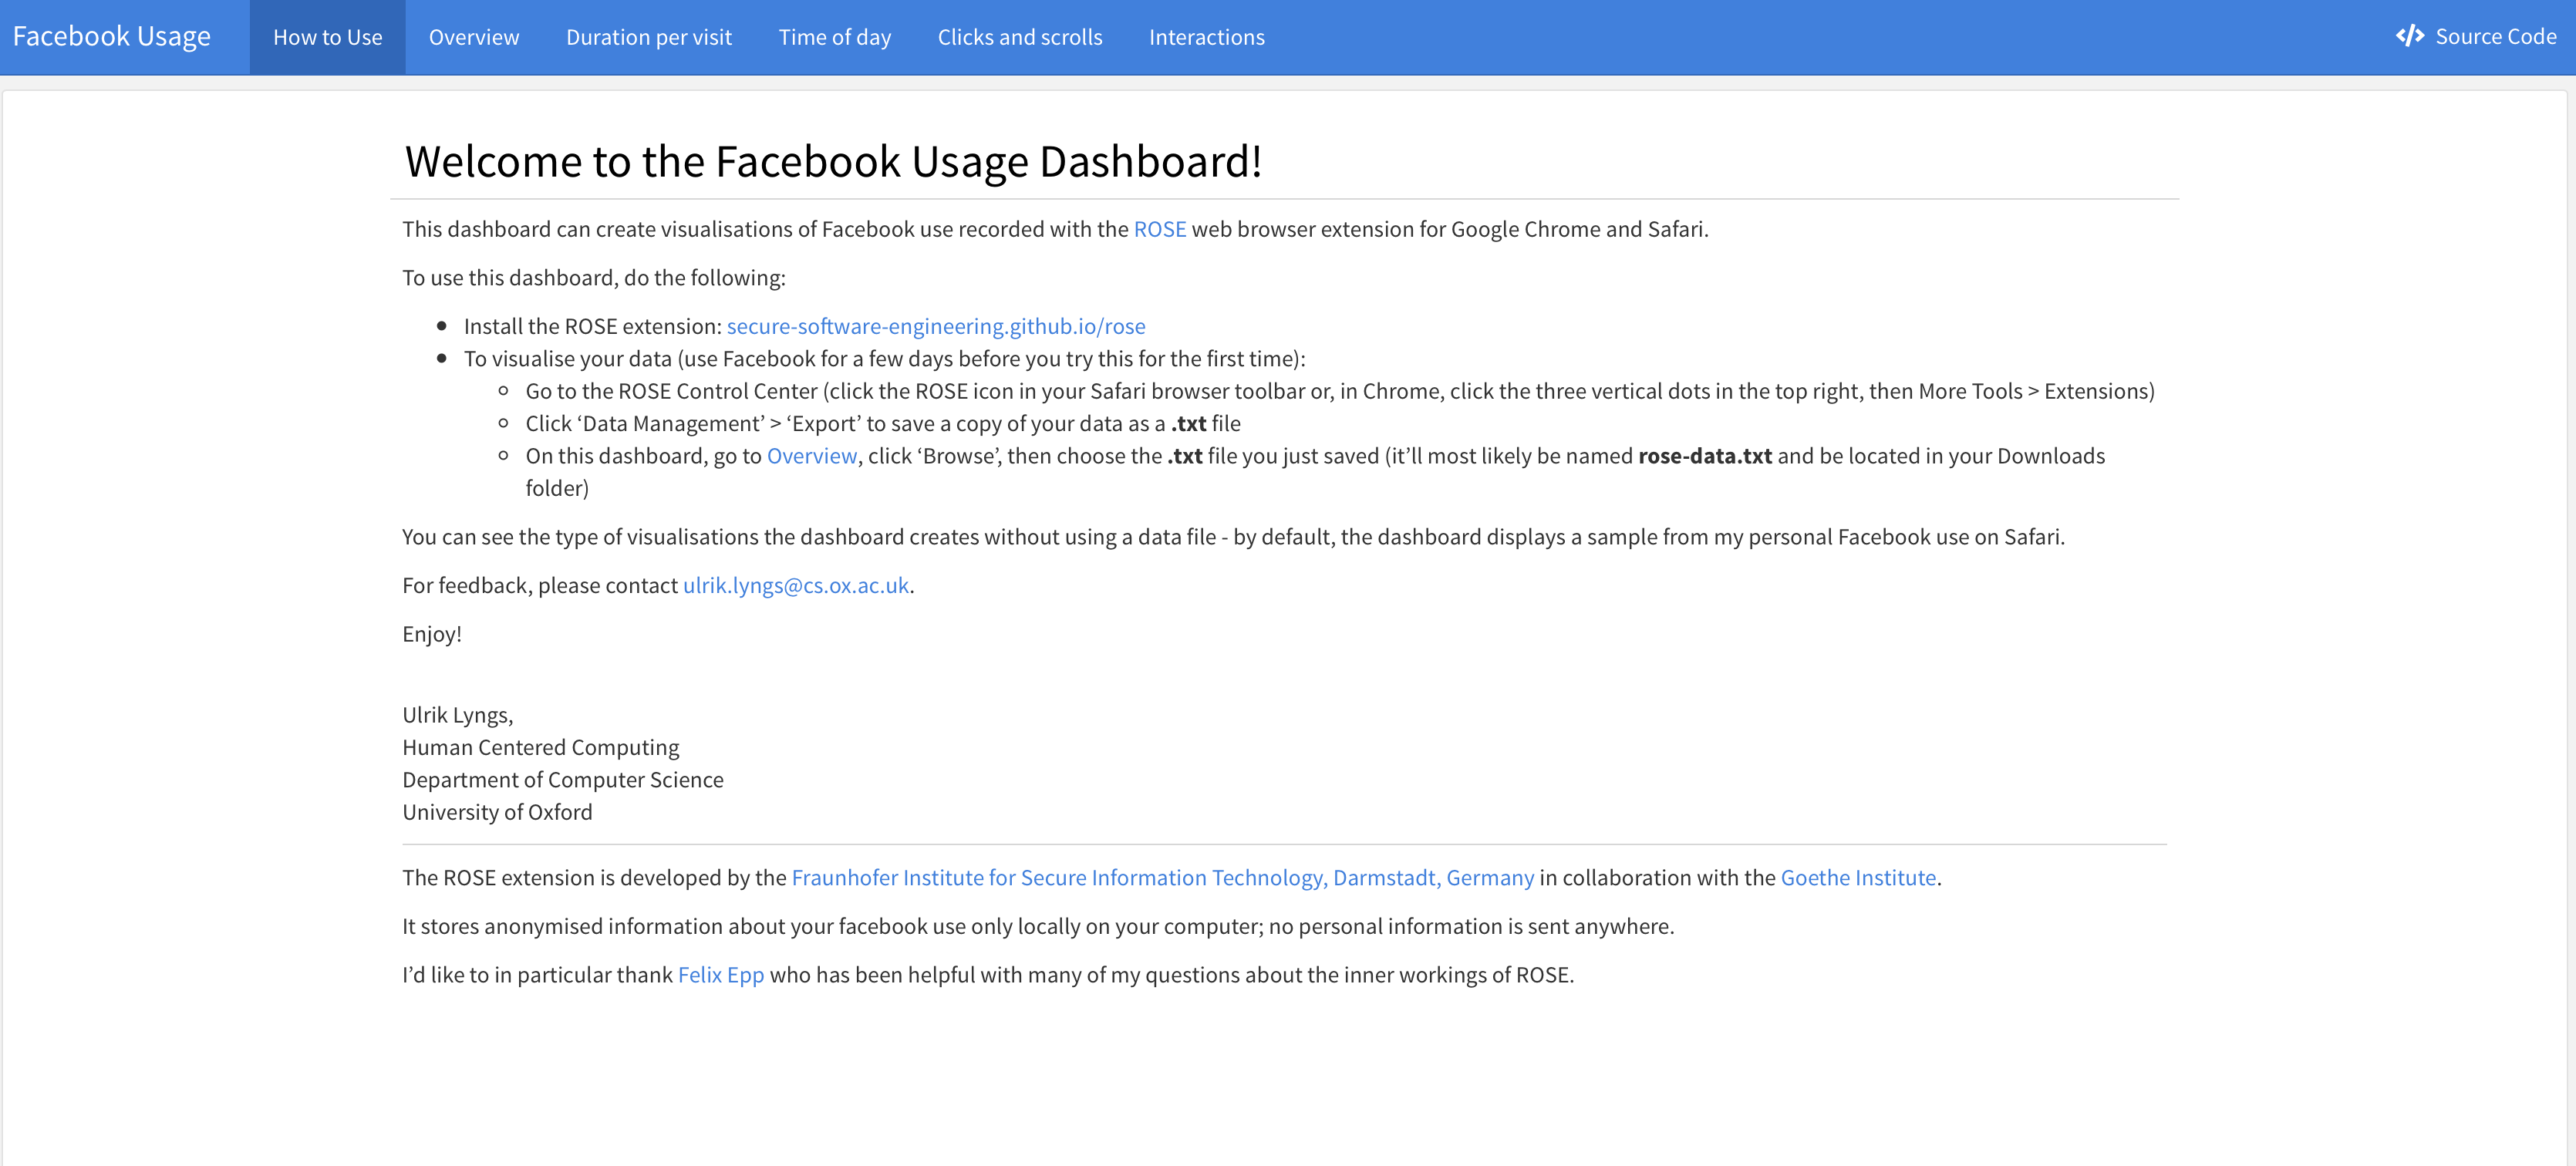
The 'overview' section is where the user can upload their own data, and shows overall metrics:
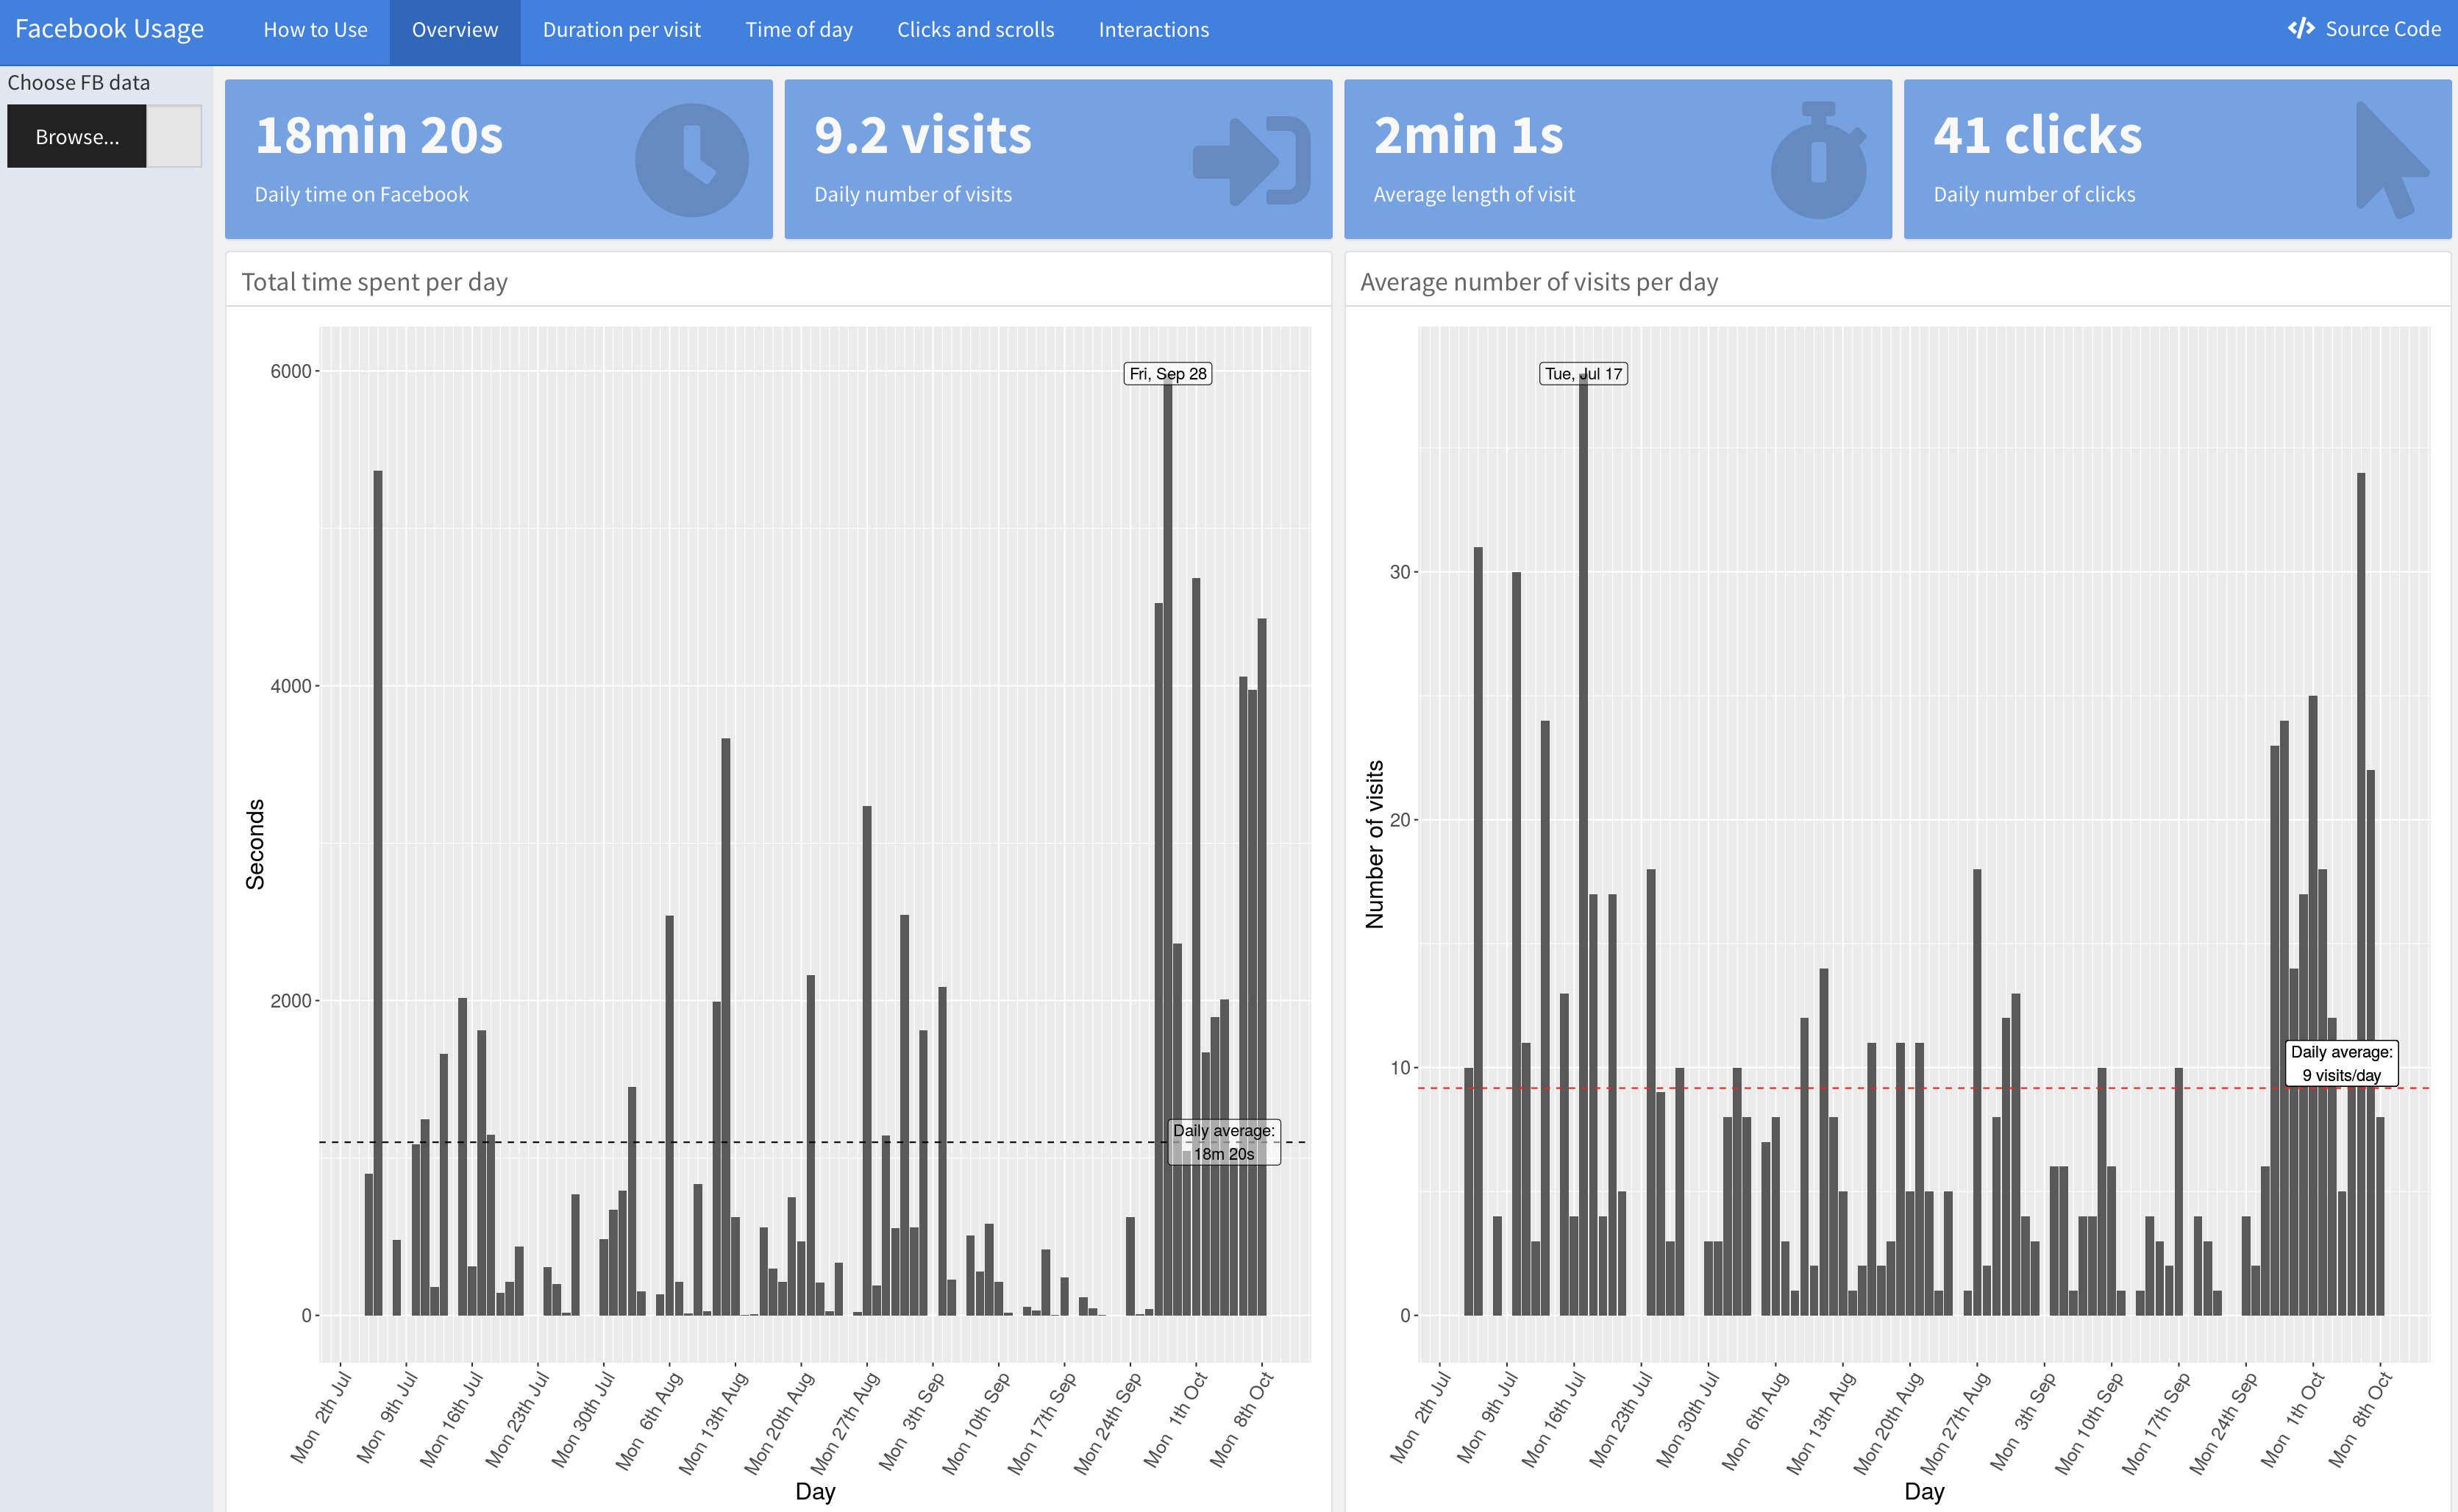
Before the user has provided any data, the dashboard by default displays a sample of my personal Facebook use on Safari.
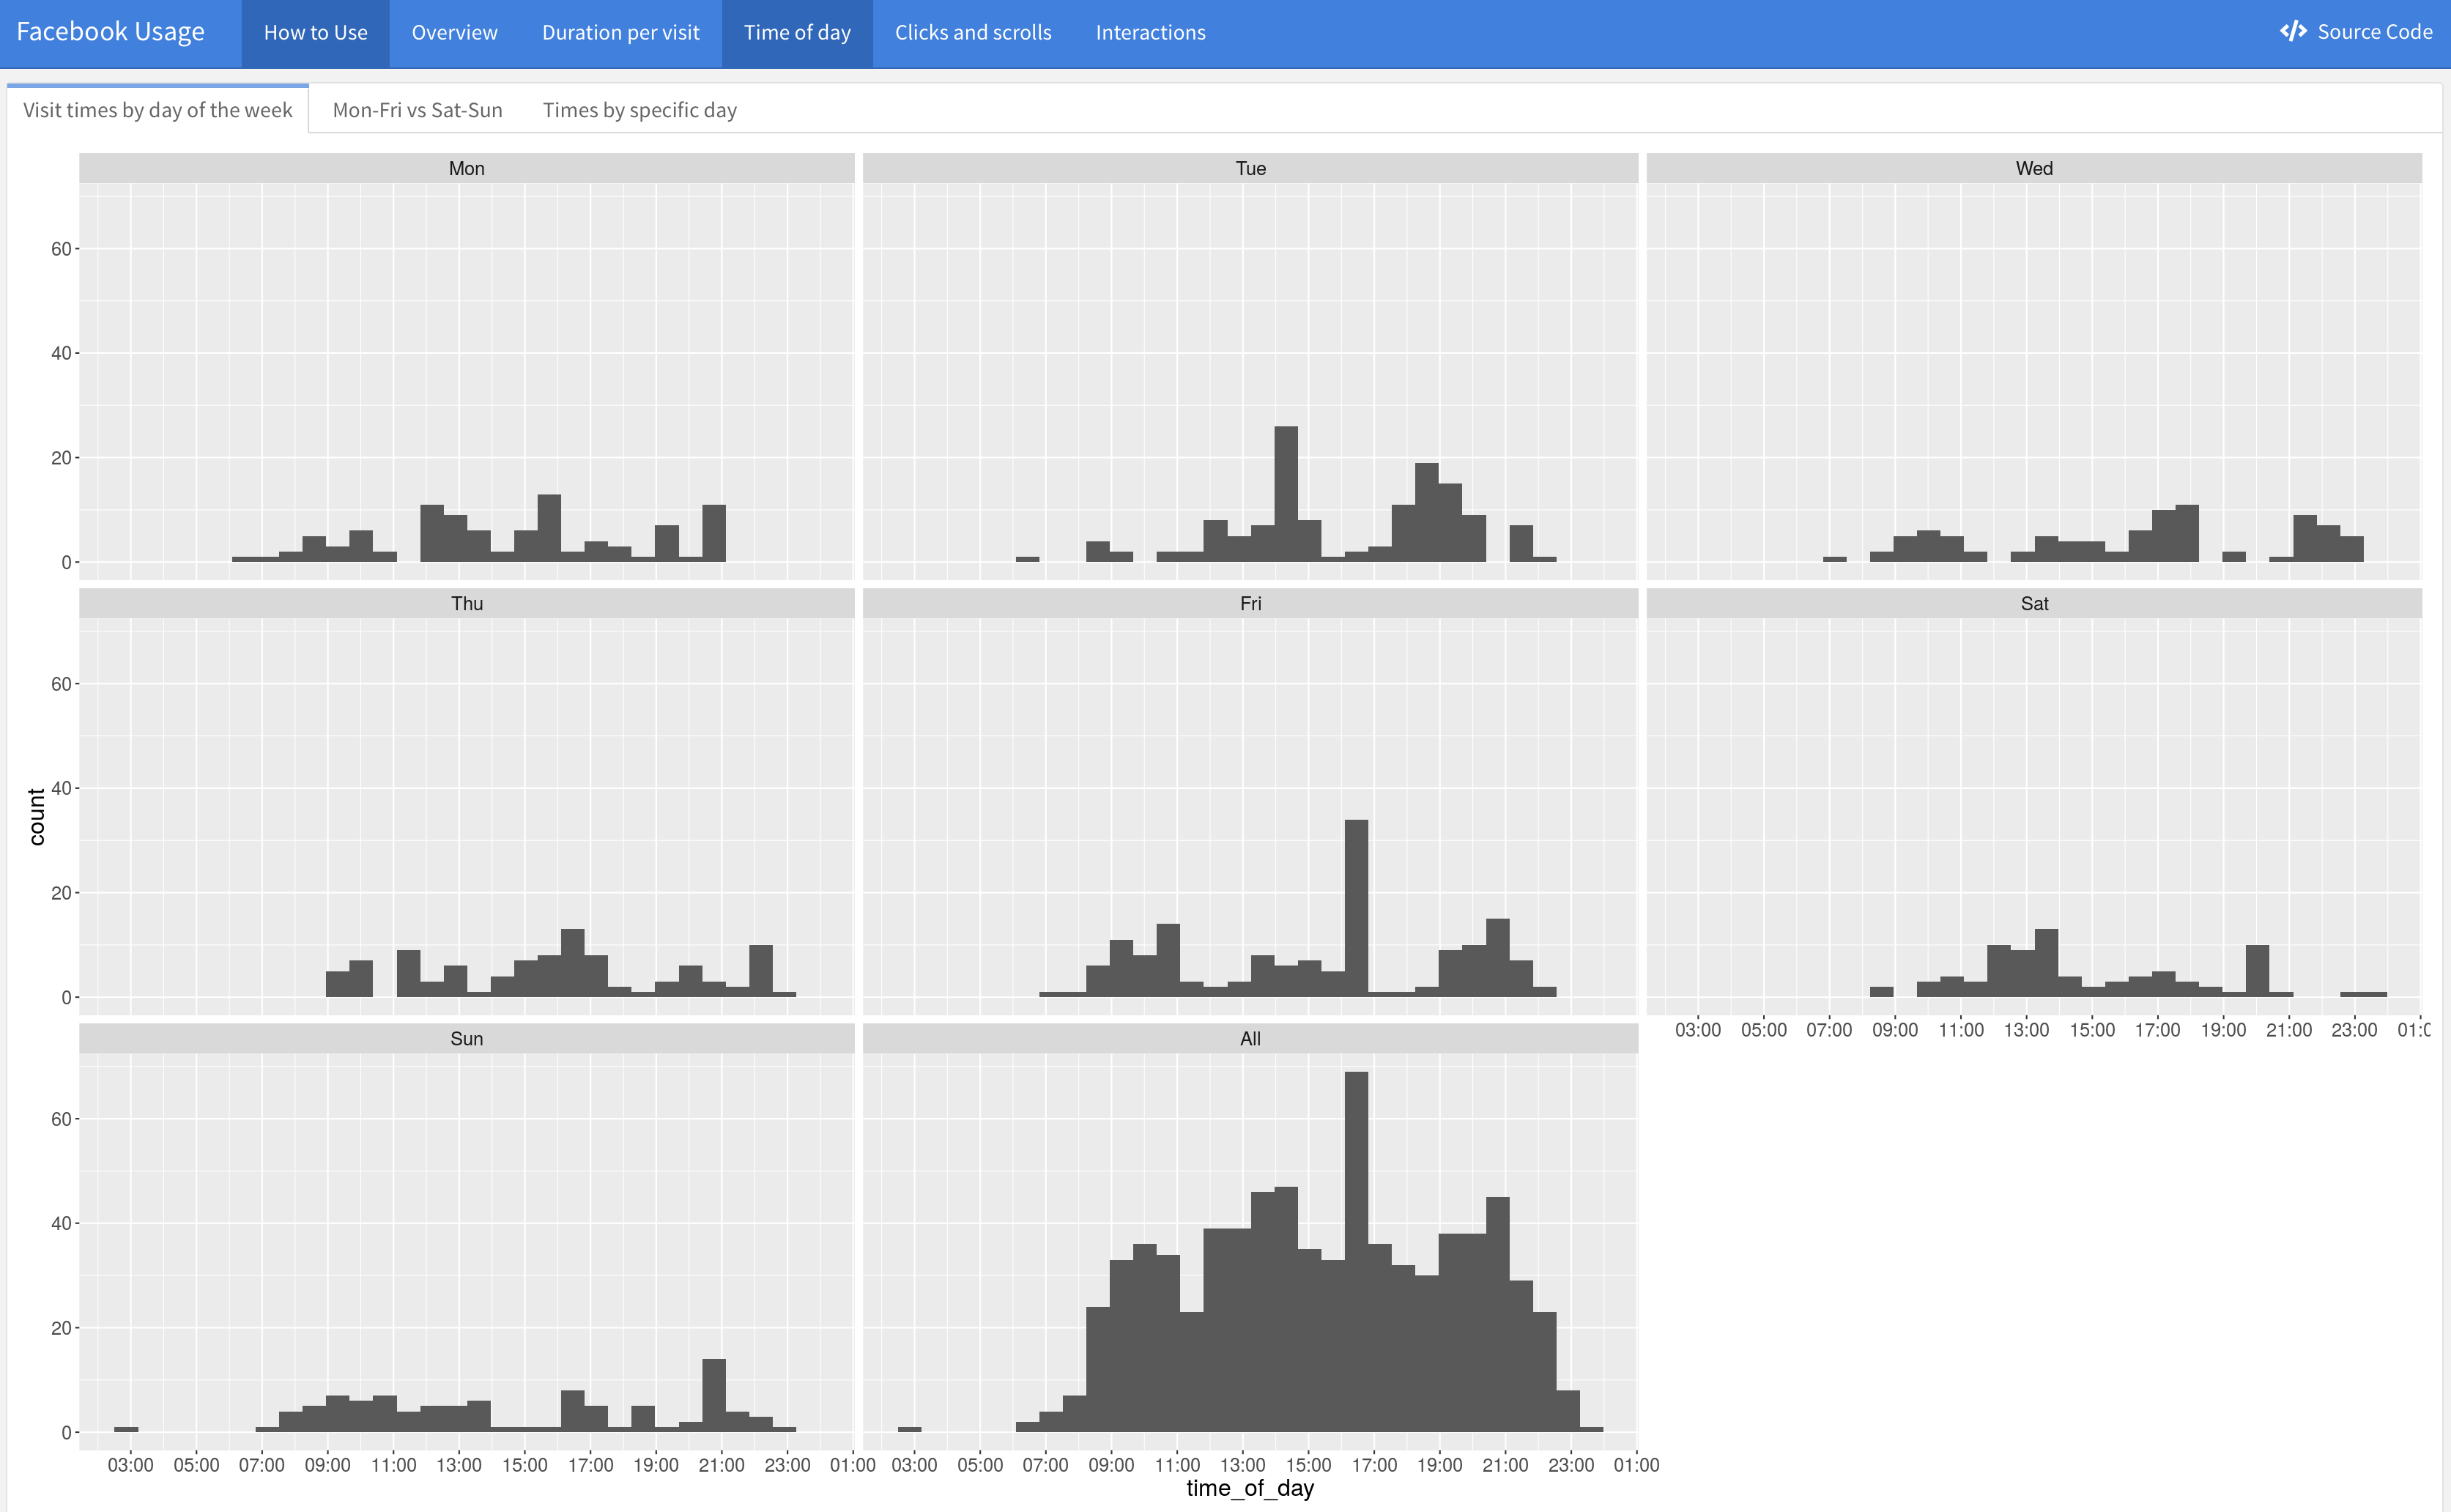
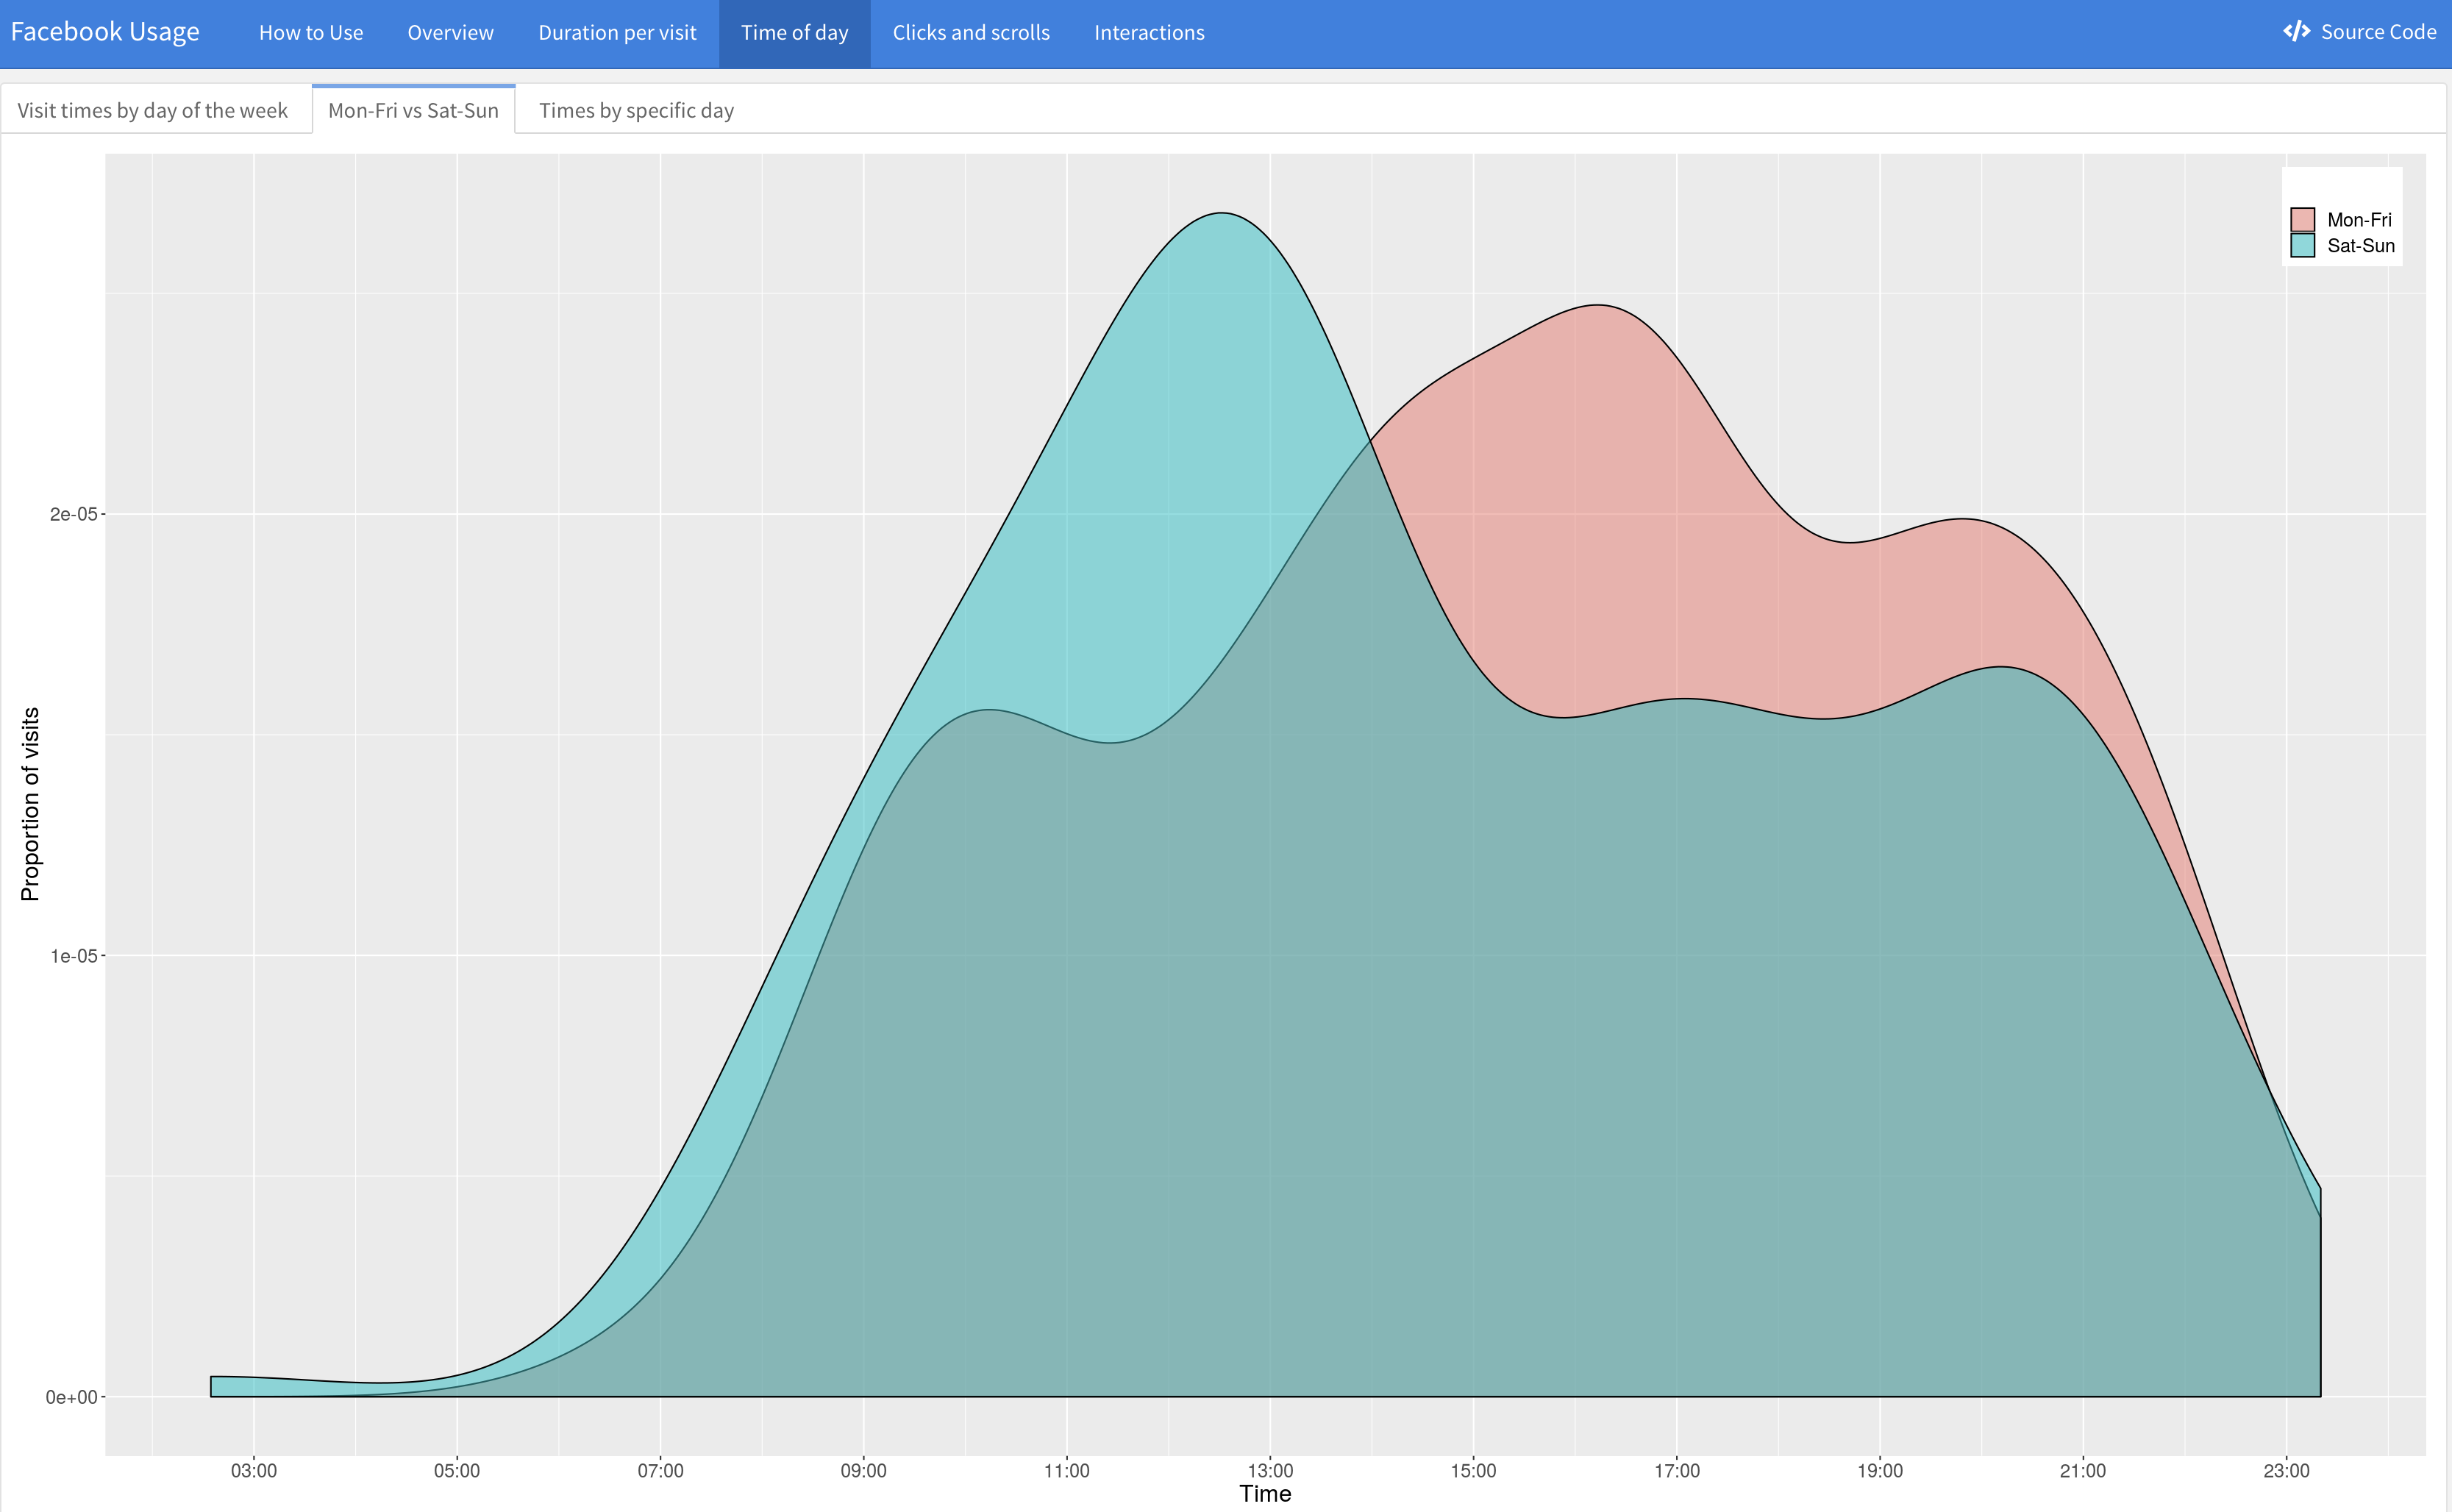
The other pages gives more information about e.g. how use compares between different days of the week.
This dashboard is implemented with flexdashboard and runtime: shiny.
The source code for the dashboard is here: rstudio.cloud/project/258673
The dashboard is deployed with shinyapps.io here: ulriklyngs.shinyapps.io/fb-dashboard-rose/
And the csv files that supply the default data displayed when first visiting the dashboard are here: github.com/ulyngs/fb-study-MT-2018/tree/master/dashboard/data
Ulrik Lyngs,
PhD student
Human Centred Computing
Department of Computer Science
University of Oxford