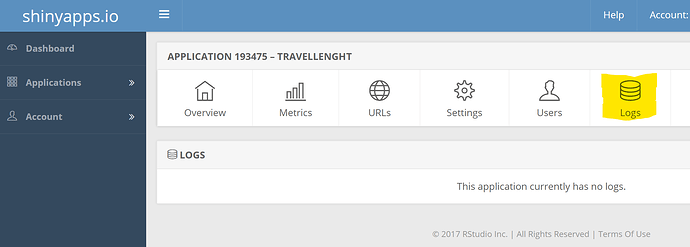
Hi there. I recently built an app that uses MLB data to build different plots. I am able to successfully deploy the app but when I try to run it through shinyapps.io, the app terminates and I get the "Application failed to start (exited with code 137)" error message. Please help!!!
This is my code for the app:
library(RSQLite)
library(DBI)
library(shiny)
library(tidyverse)
library(GeomMLBStadiums)
library(shinydashboard)
library(DT)
library(ggiraph)
library(mgcv)
library(CalledStrike)
library(ggpubr)
library(rsconnect)

SCData19 <- read.csv("data/SCData19.csv",stringsAsFactors = F)

SCData19 <-SCData19 %>%
    filter(pitches_seen >= 600)%>%
    filter(pitches_thrown >= 800)

# Define UI for application that draws a histogram
ui <- dashboardPage(skin = "blue",

                    # Application title
                    dashboardHeader(title = "2019 Statcast Review"),

                    # Setup Sidebar Tabs
                    dashboardSidebar(
                        sidebarMenu(
                            menuItem("Value Inputs", tabName = "inputs_tab"),
                            menuItem("Tables", tabName = "table_tab"),
                            menuItem("Whiff Heat Map", tabName = "whiff_tab"),
                            menuItem("wOBA Heat Map", tabName = "woba_tab"),
                            menuItem("xwOBA Heat Map", tabName = "xwoba_tab"),
                            menuItem("xHit Heat Map", tabName = "xhit_tab"),
                            menuItem("Exit Velocity Heat Map", tabName = "ev_tab"),
                            menuItem("Swing Prob Heat Map", tabName = "sp_tab")
                        )
                    ),

                    # Setup User Interface Dashboard
                    dashboardBody(tabItems(
                        tabItem(tabName = "inputs_tab",
                                box(title = "Hitter Input",width = 6,
                                    selectizeInput("bat_team","Select Team",choices = unique(SCData19$bat_team)),
                                    br(),
                                    selectizeInput("batter_name","Select Batter", choices = unique(SCData19$batter_name)),
                                    br(),
                                    selectizeInput("bat_pitch_class","Select Pitch Class", choices = unique(SCData19$pitch_class))
                                ),
                                box(title = "Pitcher Input", width = 6,
                                    selectizeInput("pitch_team","Select Team",choices = unique(SCData19$pitch_team)),
                                    br(),
                                    selectizeInput("pitcher_name","Select Pitcher",choices = unique(SCData19$pitcher_name)),
                                    br(),
                                    selectizeInput("pitch_pitch_class","Select Pitch Class", choices = unique(SCData19$pitch_class))
                                )
                        ),
                        tabItem(tabName = "table_tab",
                                box(title = "Hitter Table",width = 12,height = 360,
                                    div(style = 'overflow-x:scroll;height:500px;',DT::dataTableOutput("hitter_table"))),
                                box(title = "Pitcher Table",width = 12,height = 360,
                                    div(style = 'overflow-x:scroll;height:500px;',DT::dataTableOutput("pitcher_table")))
                        ),
                        tabItem(tabName = "whiff_tab",
                                box(title = "Hitter Swing/Miss Plot",width = 6,plotOutput("hitter_swingmiss_plot")),
                                box(title = "Pitcher Swing/Miss Plot",width = 6,plotOutput("pitcher_swingmiss_plot"))
                        ),
                        tabItem(tabName = "woba_tab",
                                box(title = "Hitter wOBA Plot",width = 6,plotOutput("hitter_woba_plot")),
                                box(title = "Pitcher wOBA Plot",width = 6,plotOutput("pitcher_woba_plot"))
                        ),
                        tabItem(tabName = "xwoba_tab",
                                box(title = "Hitter xwOBA Plot",width = 6,plotOutput("hitter_xwoba_plot")),
                                box(title = "Pitcher xwOBA Plot",width = 6,plotOutput("pitcher_xwoba_plot"))
                        ),
                        tabItem(tabName = "xhit_tab",
                                box(title = "Hitter xHit Plot",width = 6,plotOutput("hitter_xhit_plot")),
                                box(title = "Pitcher xHit Plot",width = 6,plotOutput("pitcher_xhit_plot"))
                        ),
                        tabItem(tabName = "ev_tab",
                                box(title = "Hitter Exit Velocity",width = 6,plotOutput("hitter_ev_plot")),
                                box(title = "Pitcher Exit Velocity",width = 6,plotOutput("pitcher_ev_plot"))
                        ),
                        tabItem(tabName = "sp_tab",
                                box(title = "Hitter Swing Probability",width = 6,plotOutput("hitter_sp_plot")),
                                box(title = "Pitcher Swing Probability",width = 6,plotOutput("pitcher_sp_plot"))
                        )
                    )
                    )
)

# Define server logic required to draw a histogram
server <- function(input, output, session) {

    swings = c("foul", "foul_tip", "hit_into_play", "hit_into_play_score",
               "hit_into_play_no_out", "swinging_strike", "swinging_strike_blocked")

    whiffs = c("swinging_strike", "swinging_strike_blocked")

    # Hitter Sorting and Plots
    SCData19hitter_reactive <- reactive({
        SCData19 %>%
            dplyr::filter(batter_name == input$batter_name,
                          pitch_class == input$bat_pitch_class) %>%
            mlbam_xy_transformation()
    })

    SCData19hitter_reactive_table <- reactive({
        SCData19 %>%
            dplyr::filter(batter_name == input$batter_name) %>%
            mlbam_xy_transformation()%>%
            dplyr::mutate(swing = ifelse(description %in% swings,1,0),
                          whiff = ifelse(description %in% whiffs,1,0),
                          called_strike = ifelse(description == "called_strike",1,0)) %>%
            dplyr::group_by(batter_name,pitch_class)%>%
            dplyr::summarise(pitches = n(),
                             'Average Exit Velocity' = round(mean(launch_speed,na.rm = T),3),
                             'Average Launch Angle' = round(mean(launch_angle,na.rm = T),3),
                             'Average Hit Distance' = round(mean(hit_distance_sc,na.rm = T),3),
                             swings = sum(swing),
                             whiffs = sum(whiff),
                             called_strikes = sum(called_strike)) %>%
            dplyr::mutate(whiff_pct = round(whiffs/swings,3),
                          whiff_pct = whiff_pct*100,
                          csw = round((whiffs+called_strikes)/pitches,3),
                          csw = csw*100)%>%
            dplyr::filter(pitches >= 30) %>%
            dplyr::select(batter_name, pitch_class,pitches,'Average Exit Velocity','Average Launch Angle','Average Hit Distance',whiff_pct)
    })
    bat_teams <- reactive({
        team <- subset(SCData19, bat_team %in% input$bat_team)
        team <- dplyr::select(team,"batter_name")
    })
    observe({
        updateSelectizeInput(session,"batter_name",choices = bat_teams(),selected = NULL)
    })
    output$hitter_table <- DT::renderDataTable({
        SCData19hitter_reactive_table()
    })
    output$hitter_swingmiss_plot  <- renderPlot({
        miss_swing_plot(SCData19hitter_reactive())
    })
    output$hitter_woba_plot  <- renderPlot({
        woba_plot(SCData19hitter_reactive())
    })
    output$hitter_xwoba_plot  <- renderPlot({
        ewoba_plot(SCData19hitter_reactive())
    })
    output$hitter_xhit_plot  <- renderPlot({
        ehit_plot(SCData19hitter_reactive())
    })
    output$hitter_ev_plot  <- renderPlot({
        ls_plot(SCData19hitter_reactive())
    })
    output$hitter_sp_plot  <- renderPlot({
        swing_plot(SCData19hitter_reactive())
    })
    ###########################
    # Pitcher Sorting and Plots
    SCData19pitcher_reactive <- reactive({
        SCData19 %>%
            dplyr::filter(pitcher_name == input$pitcher_name,
                          pitch_class == input$pitch_pitch_class) %>%
            mlbam_xy_transformation()
    })
    SCData19pitcher_reactive_table <- reactive({
        SCData19 %>%
            dplyr::filter(pitcher_name == input$pitcher_name) %>%
            mlbam_xy_transformation() %>%
            dplyr::mutate(swing = ifelse(description %in% swings,1,0),
                          whiff = ifelse(description %in% whiffs,1,0),
                          called_strike = ifelse(description == "called_strike",1,0)) %>%
            dplyr::group_by(pitcher_name,pitch_class)%>%
            dplyr::summarise(pitches = n(),
                             'Average Release Velocity' = round(mean(release_speed,na.rm = T),3),
                             'Average Spin Rate' = round(mean(release_spin_rate, na.rm = T),3),
                             'Average Spin Axis' = round(mean(release_spin_direction,na.rm = T),3),
                             'Average pfx_x (in feet)' = round(mean(pfx_x,na.rm = T),3),
                             'Average pfx_z (in feet)' = round(mean(pfx_z,na.rm = T),3),
                             'Average Exit Velocity Against' = round(mean(launch_speed,na.rm = T),3),
                             'Average Launch Angle Against' = round(mean(launch_angle,na.rm = T),3),
                             'Average Hit Distance Against' = round(mean(hit_distance_sc,na.rm = T),3),
                             swings = sum(swing),
                             whiffs = sum(whiff),
                             called_strikes = sum(called_strike)) %>%
            dplyr::mutate(whiff_pct = round(whiffs/swings,3),
                          whiff_pct = whiff_pct*100,
                          csw = round((whiffs+called_strikes)/pitches,3),
                          csw = csw*100)%>%
            dplyr::filter(pitches >= 30) %>%
            dplyr::select(pitcher_name,pitch_class,pitches,'Average Release Velocity','Average Spin Rate','Average Spin Axis',
                          'Average pfx_x (in feet)','Average pfx_z (in feet)',whiff_pct)
    })
    pitch_teams <- reactive({
        pitch_team <- subset(SCData19, pitch_team %in% input$pitch_team)
        pitch_team <- dplyr::select(pitch_team,"pitcher_name")
    })
    observe({
        updateSelectizeInput(session,"pitcher_name",choices = pitch_teams(),selected = NULL)
    })
    output$pitcher_table <- DT::renderDataTable({
        SCData19pitcher_reactive_table()
    })
    output$pitcher_swingmiss_plot  <- renderPlot({
        miss_swing_plot(SCData19pitcher_reactive())
    })
    output$pitcher_woba_plot  <- renderPlot({
        woba_plot(SCData19pitcher_reactive())
    })
    output$pitcher_xwoba_plot  <- renderPlot({
        ewoba_plot(SCData19pitcher_reactive())
    })
    output$pitcher_xhit_plot  <- renderPlot({
        ehit_plot(SCData19pitcher_reactive())
    })
    output$pitcher_ev_plot  <- renderPlot({
        ls_plot(SCData19pitcher_reactive())
    })
    output$pitcher_sp_plot  <- renderPlot({
        swing_plot(SCData19pitcher_reactive())
    })
}

# Run the application
shinyApp(ui = ui, server = server)
Any help would be greatly appreciated!
