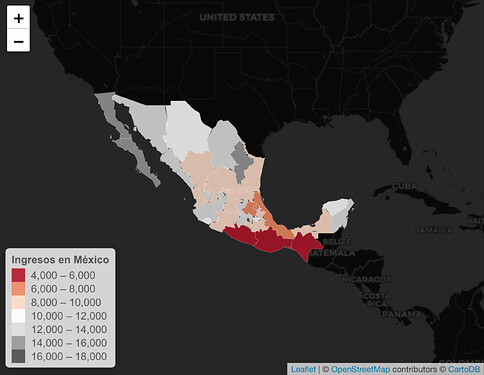
once again I turn to the kind people here, as I have a problem with a shiny app. I want to make an app that when selecting a certain variable renders a chorophet map in leaflet, something like this:
But I'm not quite sure how to work the inputs. I leave you the code that I have used so far (without success), in case you have any idea what I am doing wrong:
library(spdplyr)
library(dplyr)
library(rgdal)
library(leaflet)
# Datos
shp_mex <- readOGR("/Users/jorge_hca/Downloads/México_Estados/México_Estados.shp")
ing_mex <- read_excel("/Users/jorge_hca/Desktop/ingresos_mex.xlsx")
# Uniendo las bases
shp_mex@data <- shp_mex@data |>
left_join(ing_mex, by = c("ESTADO" = "ESTADO"))
# Cuadro de texto
mytext <- paste(
"Estado: ", shp_mex$ESTADO,"<br/>",
"Decil más bajo: ", shp_mex```
Decil 1`, "<br/>",
"Decil más alto: ", shp_mex```
Decil 10`, "<br/>",
"Total: ", shp_mex$Total,
sep="") %>%
lapply(htmltools::HTML)
ui <- bootstrapPage(
tags$style(type = "text/css", "html, body {width:100%;height:100%}"),
leafletOutput("map", width = "100%", height = "100%"),
absolutePanel(top = 10, right = 10,
selectInput("variable", "Escoge un decil:",
c("Total" = "Total",
"Decil 1" = "Decil 1",
"Decil 2" = "Decil 2",
"Decil 3" = "Decil 3",
"Decil 4" = "Decil 4",
"Decil 5" = "Decil 5",
"Decil 6" = "Decil 6",
"Decil 7" = "Decil 7",
"Decil 8" = "Decil 8",
"Decil 9" = "Decil 9",
"Decil 10" = "Decil 10"))
)
)
server <- function(input, output, session) {
mypalette <- reactive({
colorBin( palette="RdGy", domain=shp_mex$input$variable, na.color="transparent", bins=4)
})
output$map <- renderLeaflet({
leaflet(shp_mex) %>%
addTiles("http://{s}.basemaps.cartocdn.com/dark_all/{z}/{x}/{y}.png",
attribution = paste(
"© <a href=\"http://openstreetmap.org\">OpenStreetMap</a> contributors",
"© <a href=\"http://cartodb.com/attributions\">CartoDB</a>"
)) %>%
setView( lat=23, lng=-100 , zoom=4) %>%
addPolygons(
fillColor = ~mypalette(shp_mex$input$variable),
stroke=TRUE,
fillOpacity = 0.85,
color="white",
weight=0.3,
label = mytext,
labelOptions = labelOptions(
style = list("font-weight" = "normal", padding = "3px 8px"),
textsize = "13px",
direction = "auto"
)
) %>%
addLegend( pal=mypalette, values=~shp_mex$input$variable, opacity=0.9, title = "Ingresos en México", position = "bottomleft" )
})
}
shinyApp(ui, server)
I also leave the equivalent code to make the graph, in case it is also helpful to find the error in the leaflet map:
library(readxl)
library(dplyr)
library(rgdal)
# Datos
shp_mex <- readOGR("/Users/jorge_hca/Downloads/México_Estados/México_Estados.shp")
ing_mex <- read_excel("/Users/jorge_hca/Desktop/ingresos_mex.xlsx")
# Uniendo las bases
shp_mex@data <- shp_mex@data |>
left_join(ing_mex, by = c("ESTADO" = "ESTADO"))
# Mapa
mypalette <- colorBin( palette="RdGy", domain=dato```
Decil 1`, na.color="transparent", bins=4)
mytext <- paste(
"Estado: ", shp_mex$ESTADO,"<br/>",
"Decil más bajo: ", shp_mex```
Decil 1`, "<br/>",
"Decil más alto: ", shp_mex```
Decil 10`, "<br/>",
"Total: ", shp_mex$Total,
sep="") %>%
lapply(htmltools::HTML)
# Final Map
leaflet(shp_mex) %>%
addTiles("http://{s}.basemaps.cartocdn.com/dark_all/{z}/{x}/{y}.png",
attribution = paste(
"© <a href=\"http://openstreetmap.org\">OpenStreetMap</a> contributors",
"© <a href=\"http://cartodb.com/attributions\">CartoDB</a>"
)) %>%
setView( lat=23, lng=-100 , zoom=4) %>%
addPolygons(
fillColor = ~mypalette(dato```
Decil 1`),
stroke=TRUE,
fillOpacity = 0.85,
color="white",
weight=0.3,
label = mytext,
labelOptions = labelOptions(
style = list("font-weight" = "normal", padding = "3px 8px"),
textsize = "13px",
direction = "auto"
)
) %>%
addLegend( pal=mypalette, values=~dato```
Decil 10`, opacity=0.9, title = "Ingresos en México", position = "bottomleft" )
