I am creating a Shiny App for a course I am taking. I have been trying to get help from the instructor but there is a long lag in answering sometimes. I have been working on this particular project for two months because of the lag in help. I have my app code complete but my app is not showing the graphs and I am not sure what I am doing wrong. Can someone please help?
https://github.com/lwirsig/DVR-final/commit/33aa86c747e3939422d5a3a9e100dd028763ee62
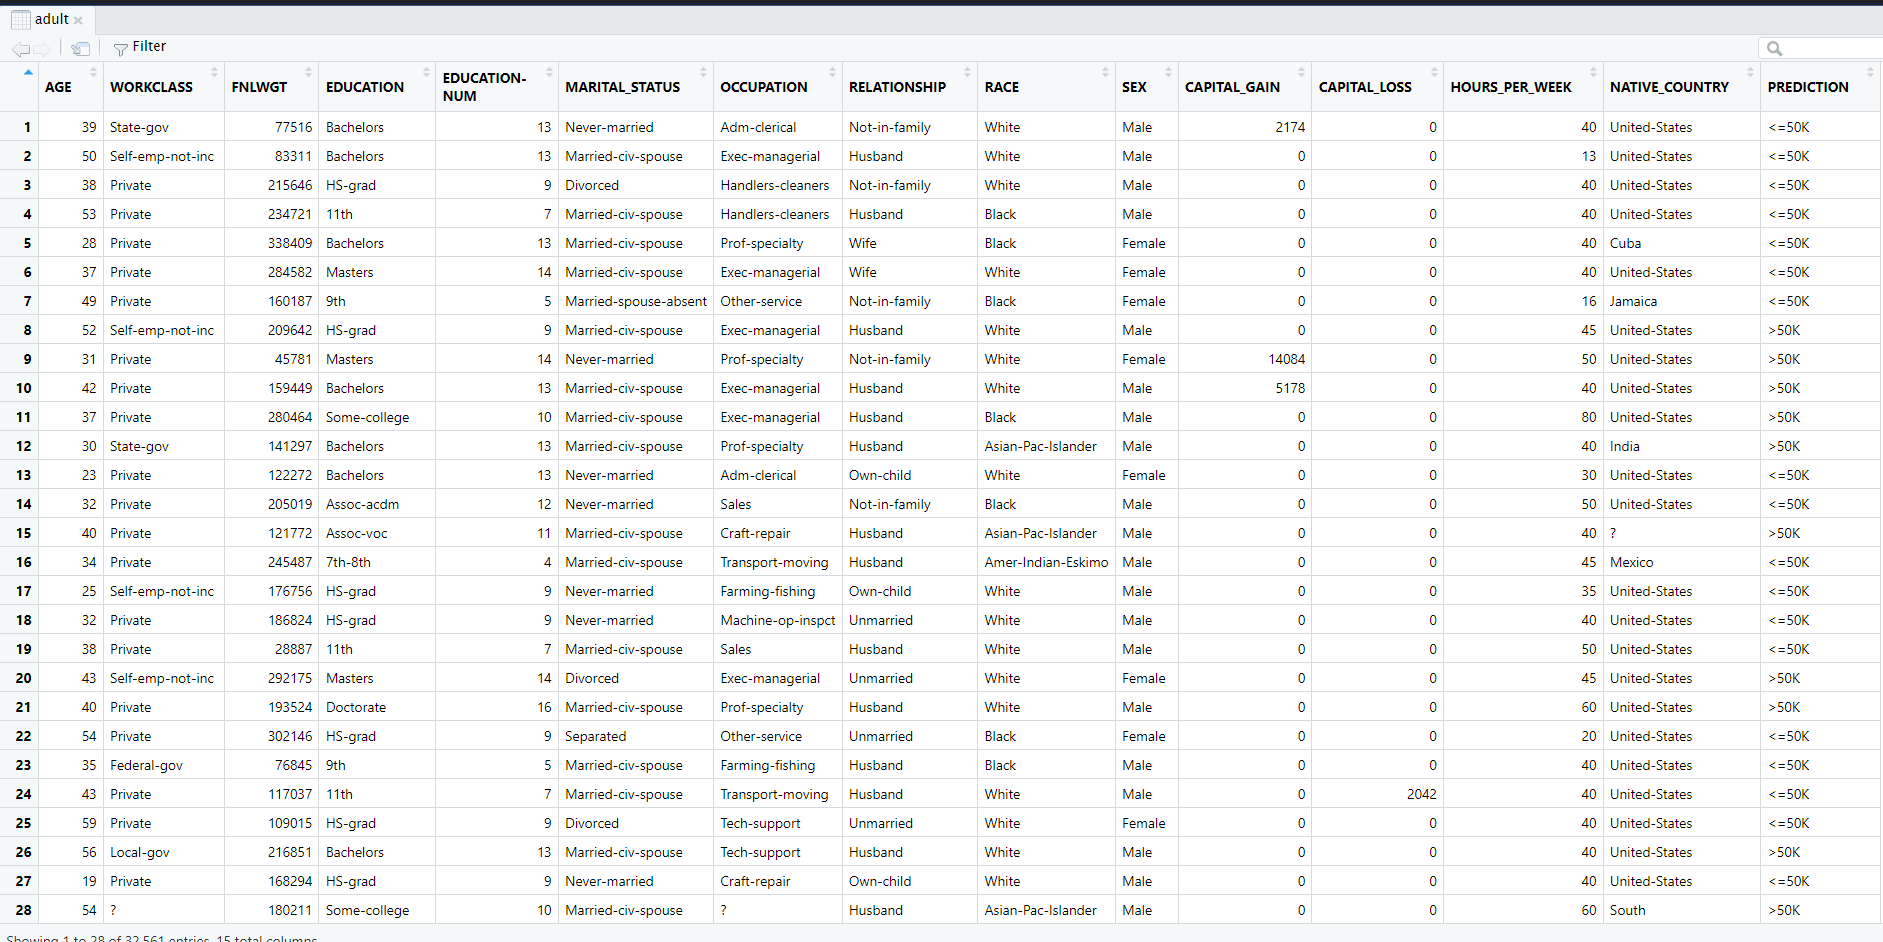
Hi, what's in adult.csv? I assume that the app has access to it.
Can you provide a reproducible example?
I am not sure how to show the whole file, but here is a screenshot of most of the information. Yes, the app has access to the file as far as I know. I imported the data file.

We don't need the whole file, but it needs to be reproducible (so not a screenshot).
Something like the output of dput(head(adult, 20)).
Have a look at the article.
I am not sure how to post an example, but I can link to my work on Rstudio cloud. It has the database imported.
https://posit.cloud/content/6266156
We can't access it because we would need to log in.
It isn't hard to post a reproducible example of the dataset.
This topic was automatically closed 21 days after the last reply. New replies are no longer allowed.
If you have a query related to it or one of the replies, start a new topic and refer back with a link.