There is no principled reason why this would happen; it doesnt happen for the most trivial example of placing a plot_usmap in a shiny app
library(usmap)
library(shiny)
ui <- fluidPage(
plotOutput("myplot")
)
server <- function(input, output, session) {
output$myplot <- renderPlot({
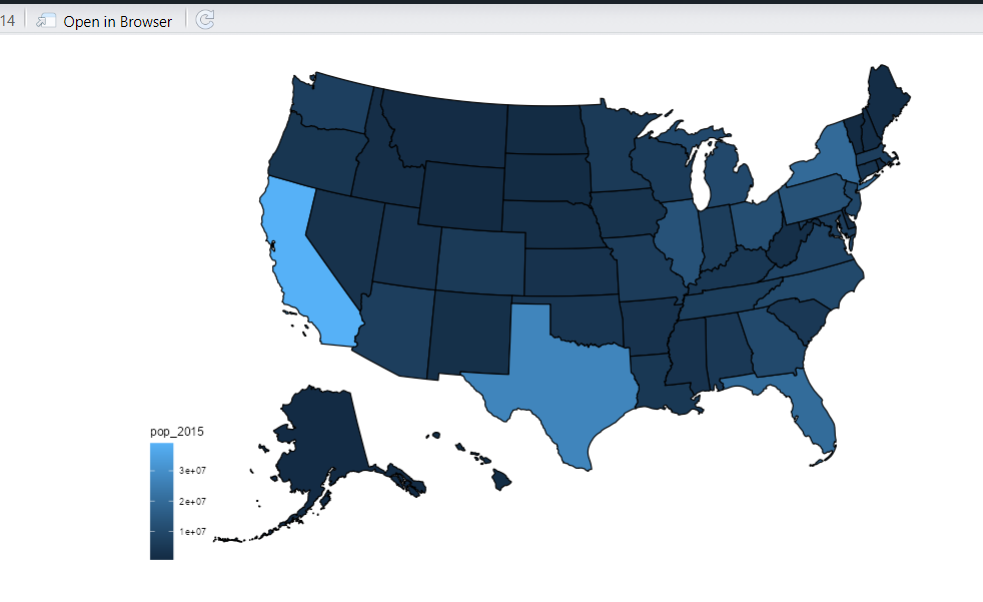
plot_usmap(data = statepop, values = "pop_2015")
})
}
shinyApp(ui, server)
Perhaps you can provide a reproducible example for the forum to work with ?
How do I share data for a reprex?
You might use tools such as the library datapasta, or the base function dput() to share a portion of data in code form, i.e. that can be copied from forum and pasted to R session.