Shiny app dynamic display of sliderInput

Hi community,

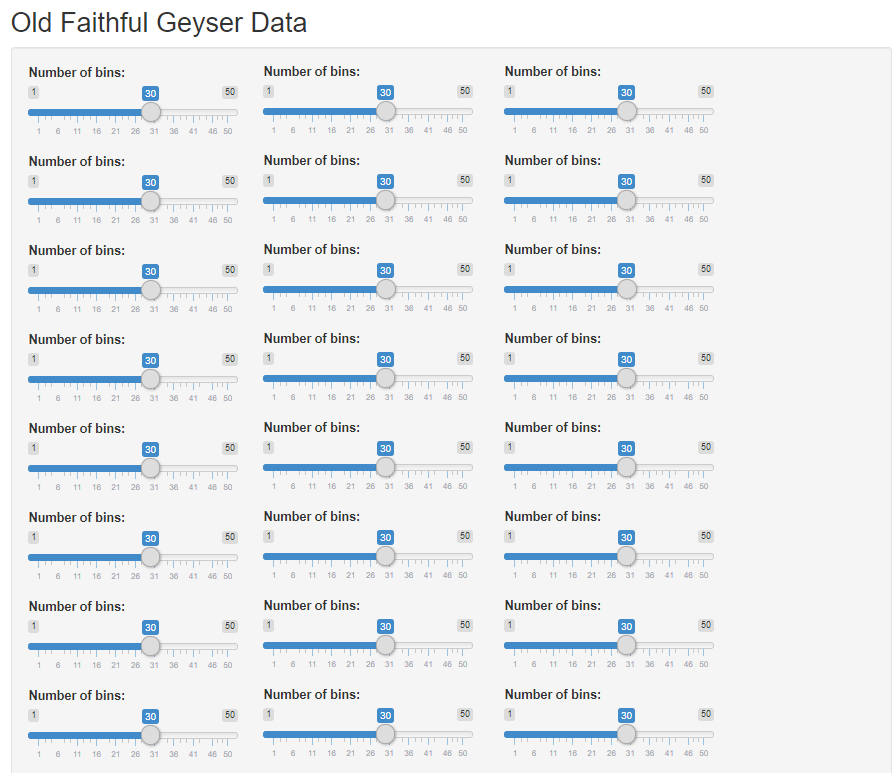
I am creating a dashboard that contains multiple sliderInput elements in dashboardBody. I need to display those multiple sliderInput elements dynamically with the changing size of the browser. However, the default is that I can have only 1 column of sliderInput elements. How could I make multiple columns (number of columns and rows change dynamically based on browser size) of my sliderInput elements in dashboardBody as listed in the following photo? Please let me know. Thanks

Sincerely,

melhzy

Hi @melhzy, I think you can achieve this by wrapping each slider in a div(style = "display: inline-block", ...) container. Here's a minimal example:

library(shiny)
library(htmltools)

sliders <- tagList(lapply(1:5, function(x) {
  div(
    style = "display: inline-block",
    sliderInput(paste0("id", x), paste("slider", x), min = 10, max = 100, value = 30)
  )
}))

ui <- fluidPage(sliders)

server <- function(input, output) {}

shinyApp(ui, server)

Thanks, but what if I need to assign each of the sliderInput different max, min, and default values? Each sliderInput represents different parameter in my case.
Then, I also need to catch each of the selected sliderInput value to do further computations. I am not sure how could I customize your code to do that. I tried but failed.

Instead of using an lapply(), you could instead create the tagList() 'by hand':

sliders <- tagList(
  div(
    style = "display: inline-block",
    sliderInput("id1", "slider1", min = 10, max = 100, value = 30)
  ),
  div(
    style = "display: inline-block",
    sliderInput("id2", "slider2", min = 10, max = 100, value = 50)
  )
)

It works, but the display in library(shinydashboard)'s dashboardBody looks funny. I tried many approaches but none of them work well. If you may have any recommendations?

sliders <- tagList(
div(
style = "display: inline-block",
sliderInput("id1", "slider1", min = 10, max = 100, value = 30, width = "90%")
),
div(
style = "display: inline-block",
sliderInput("id2", "slider2", min = 10, max = 100, value = 50, width = "90%")
),
div(
style = "display: inline-block",
sliderInput("id3", "slider3", min = 10, max = 100, value = 50, width = "90%")
),
div(
style = "display: inline-block",
sliderInput("id4", "slider4", min = 10, max = 100, value = 50, width = "90%")
),
div(
style = "display: inline-block",
sliderInput("id5", "slider5", min = 10, max = 100, value = 50, width = "90%")
),
div(
style = "display: inline-block",
sliderInput("id6", "slider6", min = 10, max = 100, value = 50, width = "90%")
),
div(
style = "display: inline-block",
sliderInput("id7", "slider7", min = 10, max = 100, value = 50, width = "90%")
)
)

Then, in the dashboardBody().

            tabItem(tabName = "tab2",
                    h2("Dashboard"),
                    br(),
                    
                    tabBox(title = "Measures",
                           
                           tabPanel(title = "KPI",
                                    
                                    fluidRow(column(width = 12,
                                                    box(title = "Choose the following parameters", 
                                                        status = "primary", 
                                                        solidHeader = T,
                                                        sliders,
                                                        width = "80%",
                                                        collapsed = TRUE, 
                                                        collapsible = TRUE
                                                        )
                                                    )
                                             )
                           ),
                           
                           width = "100%"
                    )
                    )