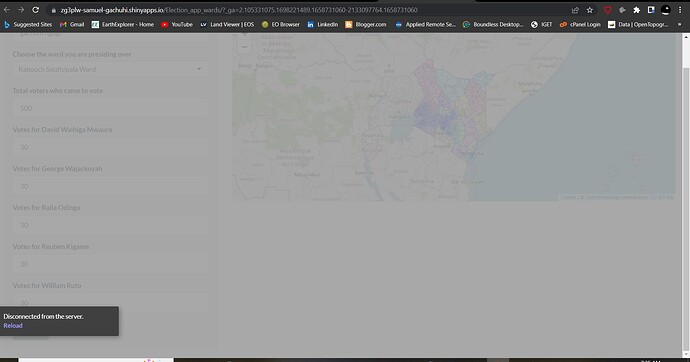
I have created a simple app where an election officer can put in the names of the voters who came to the polling station voters and the votes that each candidate has. In addition, it renders a leaflet map that shows the ward and within which subcounty or county the ward is located. The submit button is an eventReactive whereby upon clicking it the user sees the map, tabular results and their name in any of the three tabs. The app works fine in rstudio except in shinyapps.io server. In the latter, after it displays the map, it disconnects from the server. The whole r script is available from here.
Disconnected from the server.
Reload
Here is the full script for the app.
# the web map should show the total no. of voters in each constituency.

library(shiny)
library(htmltools)
library(dplyr)
library(tools)
library(leaflet)
library(rgeos)
library(rgdal)
library(sp)
library(sf)
library(DT)
library(shinythemes)

load('wards.RData')
attach(wards)

wards_shapefile <- readOGR(dsn='wards_shapefile.shp')

# create ui that show the name of presiding officer
ui <- fluidPage(
  theme = shinytheme('flatly'),
  sidebarLayout(
    sidebarPanel(
      textInput(
        inputId = 'presiding_officer',
        label = 'Name of presiding officer',
        placeholder = 'ex. Tom Omondi'
      ),

      # option to select the ward
      selectizeInput(
        inputId = 'selected_wards',
        label = 'Choose the ward you are presiding over',
        choices = c(wards$ward)
      ),

      # show the total number of voters who came to vote
      numericInput(
        inputId = 'total_voters',
        label = 'Total voters who came to vote',
        value = 0,
        min = 0,
        max = NA
      ),

      # show the results of the five different presidential candidates

      numericInput(
        inputId = 'votes_david',
        label = 'Votes for David Waihiga Mwaure',
        value = 0,
        min = 0,
        max = NA
      ),


      numericInput(
        inputId = 'votes_george',
        label = 'Votes for George Wajackoyah',
        value = 0,
        min = 0,
        max = NA
      ),


      numericInput(
        inputId = 'votes_raila',
        label = 'Votes for Raila Odinga',
        value = 0,
        min = 0,
        max = NA
      ),


      numericInput(
        inputId = 'votes_reuben',
        label = 'Votes for Reuben Kigame',
        value = 0,
        min = 0,
        max = NA
      ),


      numericInput(
        inputId = 'votes_william',
        label = 'Votes for William Ruto',
        value = 0,
        min = 0,
        max = NA
      ),

      # put the submit button
      actionButton(inputId = "submit",
                   label = "Submit")
    ),

    ## mainPanel with tabls
    mainPanel(
      tabsetPanel(
        tabPanel("Map", leafletOutput(outputId = 'wards_map', width = '100%', height = 400)),
        tabPanel("Reactive table", DTOutput(outputId = 'table_react')),
        tabPanel("Officer's name", uiOutput(outputId = 'officer_name'))
      )
    )
  )
)

# define the server function

server <- function(input, output, session){

  # in server
  server <- function(input, output, session) {

    updateSelectizeInput(session, 'selected_wards', choices =  c(wards$ward), server = TRUE)
  }

  table_results <- eventReactive(input$submit, {
    req(input$selected_wards)
    input$total_voters
    input$votes_david
    input$votes_george
    input$votes_raila
    input$votes_reuben
    input$votes_william

    data.frame(ward = input$selected_wards, voters = input$total_voters, david_waih = input$votes_david,
               george_waj = input$votes_george, raila_odin = input$votes_raila, reuben_kig = input$votes_reuben,
               william_ru = input$votes_william)
  })


  presiding_officer_name <- eventReactive(input$submit, {
    input$presiding_officer

  })

  factpal <- colorFactor(palette = rainbow(47), unique(wards_shapefile@data$county))

  map <- leaflet() %>%
    addTiles() %>%
    addPolygons(data = wards_shapefile, stroke = T, weight = 0.5,
                fillColor = ~factpal(wards_shapefile@data$county),
                fillOpacity = 0.2, popup = paste0("County: ", wards_shapefile$county, "<br>",
                                                  "Sub_county: ", wards_shapefile$subcounty, "<br>",
                                                  "Wards: ", wards_shapefile$ward))

  map_new <- reactive({

    if(input$submit) return(map)
  })

  output$wards_map <- renderLeaflet(map_new())

  br()
  br()

  # create a reactive table showing total no. of voters for each ward, and results for each of the five
  # presidential candidates
  output$table_react <- renderDT(table_results())

  br()

  output$officer_name <- renderUI({HTML(paste0("Signed by Presiding officer name: ", "<br>",
                                               presiding_officer_name()))})
}


# create the shiny app object
shinyApp(ui, server)
The shapefile wards_shapefile is heavy, as well as the wards.RData containing the table, but I don't think that should affect the app if all is done correctly. If there is any help to make the app successful when deployed it will help.
Rstudio log ------------------------
runApp('election_app_14')
Warning: package ‘shinythemes’ was built under R version 4.1.3
The following objects are masked from new_wards (pos = 4):

    county, cuid, david_waih, george_waj, gid, pop2009, raila_odin, reuben_kig, scuid,
    subcounty, uid, voters, ward, william_ru

The following objects are masked from new_wards (pos = 5):

    county, cuid, david_waih, george_waj, gid, pop2009, raila_odin, reuben_kig, scuid,
    subcounty, uid, voters, ward, william_ru

The following objects are masked from new_wards (pos = 6):

    county, cuid, david_waih, george_waj, gid, pop2009, raila_odin, reuben_kig, scuid,
    subcounty, uid, voters, ward, william_ru

The following objects are masked from new_wards (pos = 7):

    county, cuid, david_waih, george_waj, gid, pop2009, raila_odin, reuben_kig, scuid,
    subcounty, uid, voters, ward, william_ru

The following objects are masked from new_wards (pos = 9):

    county, cuid, david_waih, george_waj, gid, pop2009, raila_odin, reuben_kig, scuid,
    subcounty, uid, voters, ward, william_ru

The following objects are masked from new_wards (pos = 10):

    county, cuid, david_waih, george_waj, gid, pop2009, raila_odin, reuben_kig, scuid,
    subcounty, uid, voters, ward, william_ru

OGR data source with driver: ESRI Shapefile
Source: "E:\Documents\R Studio is here\R Studio files projects\all_new_census\election_app_14\wards_shapefile.shp", layer: "wards_shapefile"
with 1450 features
It has 14 fields
Integer64 fields read as strings:  gid Voters david_waih george_waj raila_odin reuben_kig william_ru
Warning: The select input "selected_wards" contains a large number of options; consider using server-side selectize for massively improved performance. See the Details section of the ?selectizeInput help topic.

Listening on http://127.0.0.1:4882
