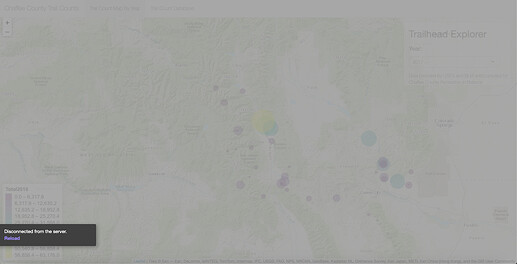
Hello
I have created this shiny app:
https://garrettrsmith.shinyapps.io/RIB_shinyapp/
When I run it locally I can switch between the years in the SelectInput drop-down menu no problem. When I deploy the app onto my shinyapps.io account and switch between years in the SelectInput drop-down menu the map goes gray and I get the "Disconnected from the server. Reload" icon.
I also cannot seem to get the popups to work for each of the circle makers.
Here is a dummy dataset that is a smaller subset of the original and the code:
site <- c("Browns Canyon", "Hancock", "Monarch Crest")
 lat <- c("38.76210", "38.70581", "38.49185")
 long <- c("-105.9776", "-106.3405", "-106.3171")
 agency <- c("BLM", "USFS", "BLM")
 Total2016 <- ("353", "1112", "9875")
 Total2017 <- c("0", "138", "7435")
 Total2018 <- c("201", "145", "16448")
 Total2019 <- c("153", "0", "9655")
 alluse <- data.frame(site, lat, long, Total2016, Total2017, Total2018, Total2019)

    ui <- navbarPage(
   "Chaffee County Trail Counts", id = "nav",
   tabPanel("Trail Count Map By Year", div(class = "outer",
                                  tags$head(
                                  includeCSS("www/style.css"),
                                  includeScript("www/gomap.js")),
                                   leafletOutput("UsageMap", width = "100%", height = "100%"),
                                   absolutePanel(id = "controls", class = "panel panel-default", fixed = TRUE,
                                                 draggable = TRUE, top = 70, left = "auto", right = 20, bottom = "auto",
                                                 width = 330, height = "auto",

                                                 h2("Trailhead Explorer"),

                                                 selectInput("year", label = h4("Year:"),
                                                             choices = c("2016" = "Total2016",
                                                                         "2017" = "Total2017",
                                                                         "2018" = "Total2018",
                                                                         "2019" = "Total2019"),
                                                             selected = "", width = "90%", multiple = FALSE),

                                                 tags$div(id="cite",
                                                          'Data provided by USFS and BLM and compiled for
                                                          Chaffee County Recreation in Balance')
                                   ))),

          tabPanel("Trail Count Database",

         DT::dataTableOutput("trailheadtable")
       ))

    server <- function(input, output, session){

    output$UsageMap <- renderLeaflet({
    leaflet() %>%
    addProviderTiles("Esri.WorldTopoMap") %>%
   setView(lng = -106.183908, lat = 38.766663, zoom = 9)
   })

 observe({
 yearcolorBy <- input$year
colorData <- alluse[[yearcolorBy]]
radius <- sqrt(alluse[[yearcolorBy]]) * 30
pal <- colorBin("viridis", colorData, 10, pretty = FALSE)

leafletProxy("UsageMap", data = alluse) %>%
clearShapes() %>%
addCircles(~long, ~lat, radius = radius, layerId =~ site,
           stroke = FALSE, fillOpacity = 0.4, fillColor = pal(colorData)) %>%
addLegend("bottomleft", pal = pal, values = colorData, title = yearcolorBy, layerId = "colorLegend")

})

showTrailheadPopup <- function(site, lat, long) {
selectedSite <- alluse[alluse$site == site,]
                          content <- as.character(tagList(
                            tags$h4("Trailhead:", as.character(selectedSite$site)),
                            tags$h3("Agency:", as.character(selectedSite$agency)),
                            tags$br(),
                            sprintf("Total 2016: %s", as.numeric(selectedSite$Total2016)), tags$br(),
                            sprintf("Total 2017: %s", as.numeric(selectedSite$Total2017)), tags$br(),
                            sprintf("Total 2018: %s", as.numeric(selectedSite$Total2018)), tags$br(),
                            sprintf("Total 2019: %s", as.numeric(selectedSite$Total2019))
                          ))
                          leafletProxy("UsageMap") %>% addPopups(lat, long, content, layerId = site)
    }

observe({
leafletProxy("UsageMap") %>% clearPopups()
event <- input$map_shape_click
if (is.null(event))
return()

isolate({
showTrailheadPopup(event$id, event$lat, event$long)
})
})

output$trailheadtable <- DT::renderDataTable({
alluse %>%
filter(is.null(input$site)) %>%
mutate(Action = paste('<a class="go-map" href="" data-lat="', lat,
                      '" data-long="', long, '" data-trailhead="', site, '"><i class="fa fa-crosshairs"></i></a>',
 sep=""))
 action <- DT::dataTableAjax(session, alluse, outputId = "trailheadtable")

 DT::datatable(alluse, options = list(ajax = list(url = action)), escape = FALSE)

 })

}
I am also having an issue with the popups not working.
Thank you for any help you can provide.
