Shiny App - Add dynamically annotation on dygraph when user clicks on the line

Hello all,

I'm using dygraph on a Shiny App.
I want the user add dynamically an annotation on a plotted line when he clicks on it.
I also want him able to edit this annotation.

I spent a lot of time trying but I can't find a way to do it in a ShinyApp. Could you help me ?

Here a basic application involving a dygraph

library(shiny)
library(dygraphs)

X <- c(1,2,3,4,5,6,7,8,9,10)
Y<-c(100,200,250,267,234,88,78,90,15,32)

data <- data.frame(X,Y)

ui <- fluidPage(

   titlePanel("Test"),

   sidebarLayout(
      sidebarPanel(
      ),
      mainPanel(
         dygraphOutput("plot")

      )
   )
)


server <- function(input, output) {

  output$plot <- renderDygraph({
                                p <- dygraph(data)%>% dyRangeSelector()
  })

}


shinyApp(ui = ui, server = server)`

I feel the answer is somewhere around dyAnnotation() or dyCallbacks with a pointClickCallback = but I can't managed it with JS code.

If someone know how to solve it with another library (like plotly) feel free to tell me how.

Thanks a lot in advance
1 Like

Great reprex! And thank you for the main functions to look at!

There is a javascript method that Shiny adds called Shiny.setInputValue(key, value). You can read more about it here: Shiny - Communicating with Shiny via JavaScript

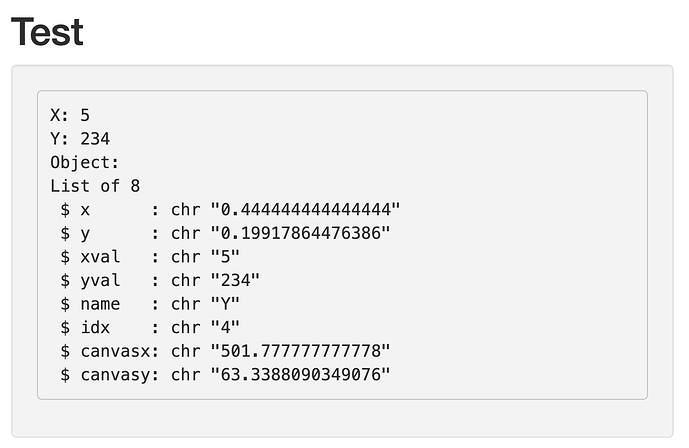
In the updated example, I used the dyCallbacks(clickCallback = "JavaScriptCode") functionality to set a callback that will call Shiny.setInputValue. The key used in Shiny.setInputValue can then be read as a regular input in the application.

Once the value is retrieved, it is standard shiny code.

library(shiny)
library(dygraphs)

X <- c(1,2,3,4,5,6,7,8,9,10)
Y<-c(100,200,250,267,234,88,78,90,15,32)

data <- data.frame(X,Y)

ui <- fluidPage(
   titlePanel("Test"),
   sidebarLayout(
      sidebarPanel(
        ### Add a status area to display output
        verbatimTextOutput("status")
      ),
      mainPanel(
         dygraphOutput("plot")
      )
   )
)


server <- function(input, output) {

  output$plot <- renderDygraph({
    p <- 
      dygraph(data, xlab = "X", ylab = "Y") %>% 
      ### Add a `clickCallback` that will set the shiny input value.
      ### With JavaScript, you can look at all the arguments supplied to the function. 
      ### For the click callback, the arguments are the Event, some location information, all location information.
      ### JavaScript is a 0 based counting language, so we pull the '3rd' value from the '2nd' position
      dyCallbacks(clickCallback = "function() { console.log(arguments); Shiny.setInputValue('dygraph_click', arguments[2]); }") %>%
      dyRangeSelector()
  })

  ### Make sure the input value is a list
  dygraph_click <- reactive({
    as.list(input$dygraph_click)
  })

  ### Extract possibly useful information
  clickX <- reactive({dygraph_click()$xval})
  clickY <- reactive({dygraph_click()$yval})
  
  ### Print the information
  printVal <- reactive({
    paste0(capture.output({str(dygraph_click())}), collapse = "\n")
  })

  ### Display the information
  output$status <- renderText({
    paste0(
      "X: ", clickX(), "\n",
      "Y: ", clickY(), "\n",
      "Object:\n",
      printVal()
    )
  })
}

shinyApp(ui = ui, server = server)

2 Likes

Hello Barret,

Thank you for you answer, it's very helpful and I understand better the Shiny.set.InputValue() function now ! Thanks for that.

Nevertheless, with that it seems we cannot directly set an annotation on our dygraph. I mean the clickcallback function gives us information on the point (or nearest point) clicked (x and y values for example..) and we catch it on Shiny with Shiny.set.Input.Value but we don't know which dygraph has been clicked.

So here is my problem to set my annotation after the click:
if I want to do something like which is presented below, I have not the dygraph name which has been clicked

observeEvent{ 
             input$dygraph_click,
             dyAnnotation ( "the dygraph_clicked"(???), "text in my annotation",...)
            }

I was wondering if it's possible to add the dygraph name or Id on the shiny.set.input.value in addition of argument[2] ?

Hope I'm clear.
Thanks again for you help and for your explanations very clear about shiny.set.input.Value. I am sure we are close of the solution

Kind regards

You're correct. The name would be impossible to find in the current setup.


To follow patterns of shiny and leaflet, we can make the input value name unique for each plot. Looking at the leaflet docs under "Inputs/Events" in https://rstudio.github.io/leaflet/shiny.html, we will use the pattern:

input$MAPID_OBJCATEGORY_EVENTNAME
or
input$MAPID_EVENTNAME

The event being captured above is on the plot as a whole, so we'll follow input$MAPID_EVENTNAME.
In the reprex, output$plot is used. So MAPID is plot and our EVENTNAME is click. So the input key we should set is plot_click.

Cleaning up the code and only altering the key in Shiny.setInputValue, we get the final product of:

#....
dyCallbacks(
  clickCallback = 
    "function() { Shiny.setInputValue('plot_click', arguments[2]); }"
) %>%
#....

Using this approach, it should scale for many dygraphs with multiple events each.


There is nothing wrong with prefixing the input values to make them more unique so they do not clash with other existing input keys. Ex: Use the shape of input$cb_ID_EVENT (like cb_plot_click) where cb_ represents the idea of "callback".

Thanks Barrett !

I'will try to test something with it. If I success I post the solution

1 Like

This topic was automatically closed 54 days after the last reply. New replies are no longer allowed.