Is there any Stats for geom_jitter or geom_counts similar to SHADE = TRUE from the mosaicplots?
Here is the data:
table4 <- matrix(c(188, 29, 20, 51), ncol = 2, byrow = TRUE)
colnames(table4) <- c("yes","no") #mother
rownames(table4) <- c("yes", "no") #children
names(table4)[1] <- "Children"
names(table4)[2] <- "Mothers"
table4 <- as.table(table4)
table4
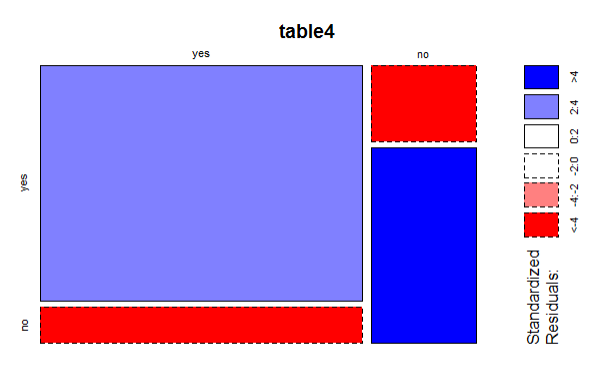
the corresponding mosaic plot is:
mosaicplot(table4, shade = TRUE)
Recreate the data
df <- data.frame(as.table(originalTable))[rep(sequence(prod(dim(originalTable))),
                                        c(originalTable)), c(1, 2)]
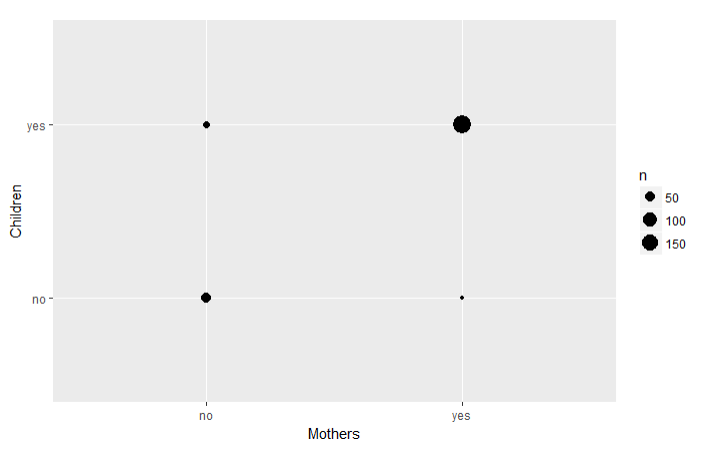
Could be possible to add any graphic representation to residuals in a geom_count or jitter?
df %>%
  ggplot(aes(x = Mothers, y = Children)) +
  geom_count()
Thanks in advance!