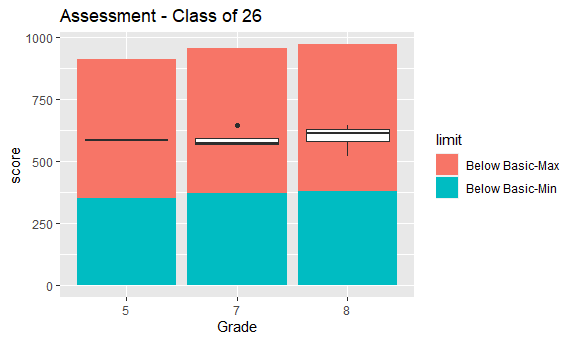
You can get the shading by plotting a geom_col() with the right fill, and then plotting the boxplot on top.
I'm a bit confused about the exact values in pl, here is a start:
pl_long <- pl |>
  pivot_longer(cols = -c(Subject, Grade),
               names_to = "limit",
               values_to = "score") |>
  mutate(Grade = as.character(Grade))


ggplot() +
  geom_col(aes(x = Grade, y= score, fill = limit),
           data = pl_long |>
             filter(Subject == "ELA",
                    limit %in% c("Below Basic-Min", "Below Basic-Max"),
                    Grade %in% unique(df$Grade))
           ) +
  geom_boxplot(aes(Grade, Score),
               data = df,
               inherit.aes = FALSE) +
  labs(title = paste("Assessment - Class of",df$Cohort))