setting the class of dicotomic outcome in glm function

Hallo R studio Community.

I am having an issue with the interpration of glm function.
Let's consider this df

df = data.frame(alive = c("FALSE","TRUE","FALSE","FALSE","TRUE","TRUE","TRUE","TRUE","TRUE"),
                sex = rep(c("M","M","F"),3),
                age  =c(1,1,1,5,3,2,5,4,3))

and then I reassess variables classes

df$sex <- as.factor(df$sex)
df$alive <- as.logical(df$alive)

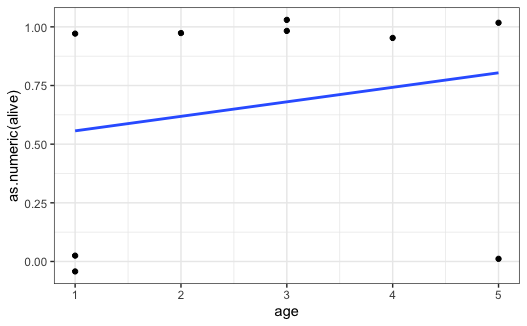
Now I fit my regression

f1 <- glm(alive  ~ age, data = df, family = "binomial")
summary(f1)
tidy(f1, exponentiate = TRUE, conf.int = TRUE)

here I get

> tidy(f1, exponentiate = TRUE, conf.int = TRUE)
# A tibble: 2 x 7
  term        estimate std.error statistic p.value conf.low conf.high
  <chr>          <dbl>     <dbl>     <dbl>   <dbl>    <dbl>     <dbl>
1 (Intercept)    0.924     1.42    -0.0556   0.956   0.0482     19.1 
2 age            1.34      0.484    0.600    0.548   0.535       4.12```

My question: should the dicotomic outcome (alive) be expressed in logical class or in numeric class ( 0 / 1)? And if it is numeric class, should be "no outcome" = 0 and
"yes outcome"= 1 ?

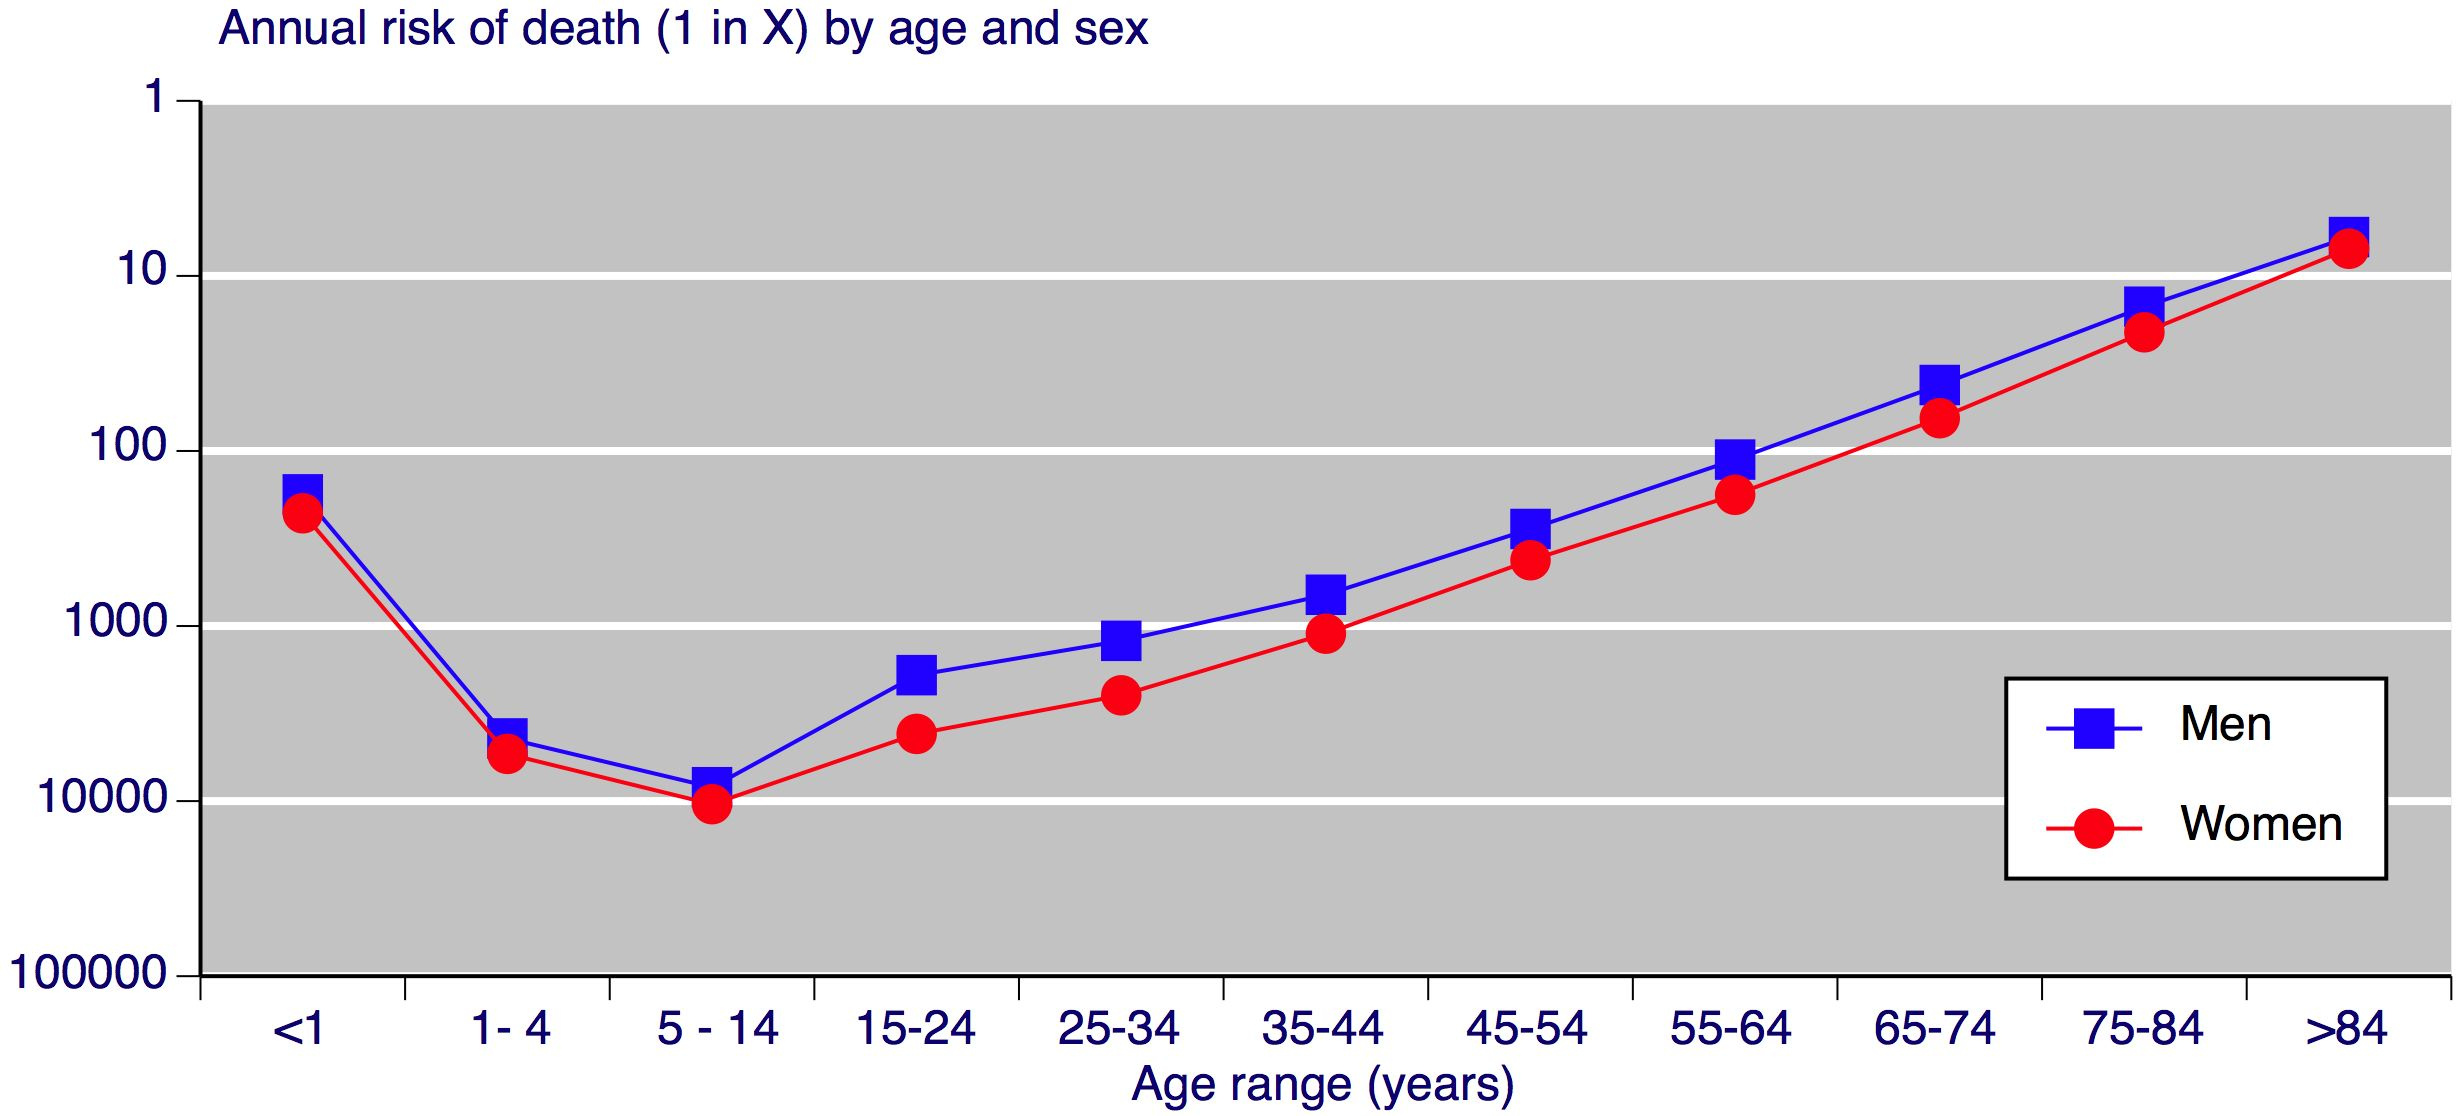
I am having trouble with my real life dataset, because I get strange odds ratio ( the opposite for what I expected, and I am afraid I am missing something.

Compared to the example in the reprex, in my real life dataset is like if I would have <1 estimated odds ratio, even if I am sure that increasing age is a risk factor for mortality.

Thanks in advance for your help!

but for the very young it isnt ...
http://www.bandolier.org.uk/booth/Risk/dyingage.html

Are you trying to predict df$alive based on age alone? You have the variable df$sex but it is unused.

Your example data frame encodes a slightly increasing probability of being alive as age increases, which is probably the opposite of what your real-world data says.

Note in the plot below that the cases of alive=TRUE are symmetric about age=3, but there are two cases of alive=FALSE at age=1 and only one case of alive=FALSE at age=5.

library(tidyverse)

ggplot(df, aes(age, as.numeric(alive))) + 
  geom_jitter(width=0, height=0.05) +
  geom_smooth(method="lm", se=FALSE) +
  theme_bw()

Rplot01

The predicted probability being alive will be the same whether you encode being "alive" as 1 and "dead" as 0 or the reverse. You just have to remember to also reverse the interpretation of the regression coefficients, odds, odds ratios, and probabilities.

For example, in the code below, we show that inverting FALSE and TRUE (so that TRUE switches from meaning "alive" to meaning "dead") inverts the odds.

library(tidyverse)

df = data.frame(alive = c("FALSE","TRUE","FALSE","FALSE","TRUE","TRUE","TRUE","TRUE","TRUE"),
                sex = rep(c("M","M","F"),3),
                age  =c(1,1,1,5,3,2,5,4,3))

df$sex <- as.factor(df$sex)
df$alive <- as.logical(df$alive)

f1 <- glm(alive  ~ age, data = df, family = "binomial")
exp(coef(f1))
#> (Intercept)         age 
#>   0.9238026   1.3370519

# Reverse the meaning of TRUE and FALSE in df$alive
f2 <- glm(alive  ~ age, 
          data = df %>% mutate(alive = 1 - alive), 
          family = "binomial")

exp(coef(f2))
#> (Intercept)         age 
#>   1.0824824   0.7479141
1/exp(coef(f2))
#> (Intercept)         age 
#>   0.9238026   1.3370519

If you expect to switch back and forth between which outcome is 0 and which is 1, to avoid confusion of the meaning of df$alive values it might be better to have the data values be meaningful words like "Alive" and "Dead" rather than logicals or the numbers 0 and 1 and encode the column as a factor. Then if you want to change the reference category you can just change the order of the levels.

For example, in the code below, when "Alive" is the reference category, predictions on the response scale will be the odds of Dead to Alive. To get the odds of Alive to Dead, invert the odds. Predictions on the probability scale will be the probability of being dead. The probability of being alive is 1 minus the probability of being dead. This all gets reversed (or inverted) when "Dead" is the reference category.

d = tibble(alive=c("Alive", "Dead", "Alive", "Alive")

# Alive is the reference category
d$alive = factor(d$alive, levels=c("Alive", "Dead"))  

# Dead is the reference category
d$alive = factor(d$alive, levels=c("Dead", "Alive"))

This topic was automatically closed 7 days after the last reply. New replies are no longer allowed.