If you want to set an aesthetic to a constant value, that should be done outside of the aes() function. The aes() function is for mapping data values to aesthetics.
I don't think the default line and points have a fill aesthetic; they only have color.
gplot(BxTC, aes(x = Backlight, y = Mean, group = TargetColor)) +
geom_line(show.legend = FALSE, color = "pink", fill = "green", size = 2.4) +
geom_point(show.legend = FALSE, color = "pink", fill = "green", size = 6) +
Thank you! Your reply has gotten me close to understanding not only how to control graphing colors, but the sizes of the geoms, as well.
There's at least one more thing I'm missing, though. I believe the code below should produce a chart with red, green, and yellow lines, points, and error bars with black outlining. Instead, I get "! object 'TargetColor' not found".
Preformatted text
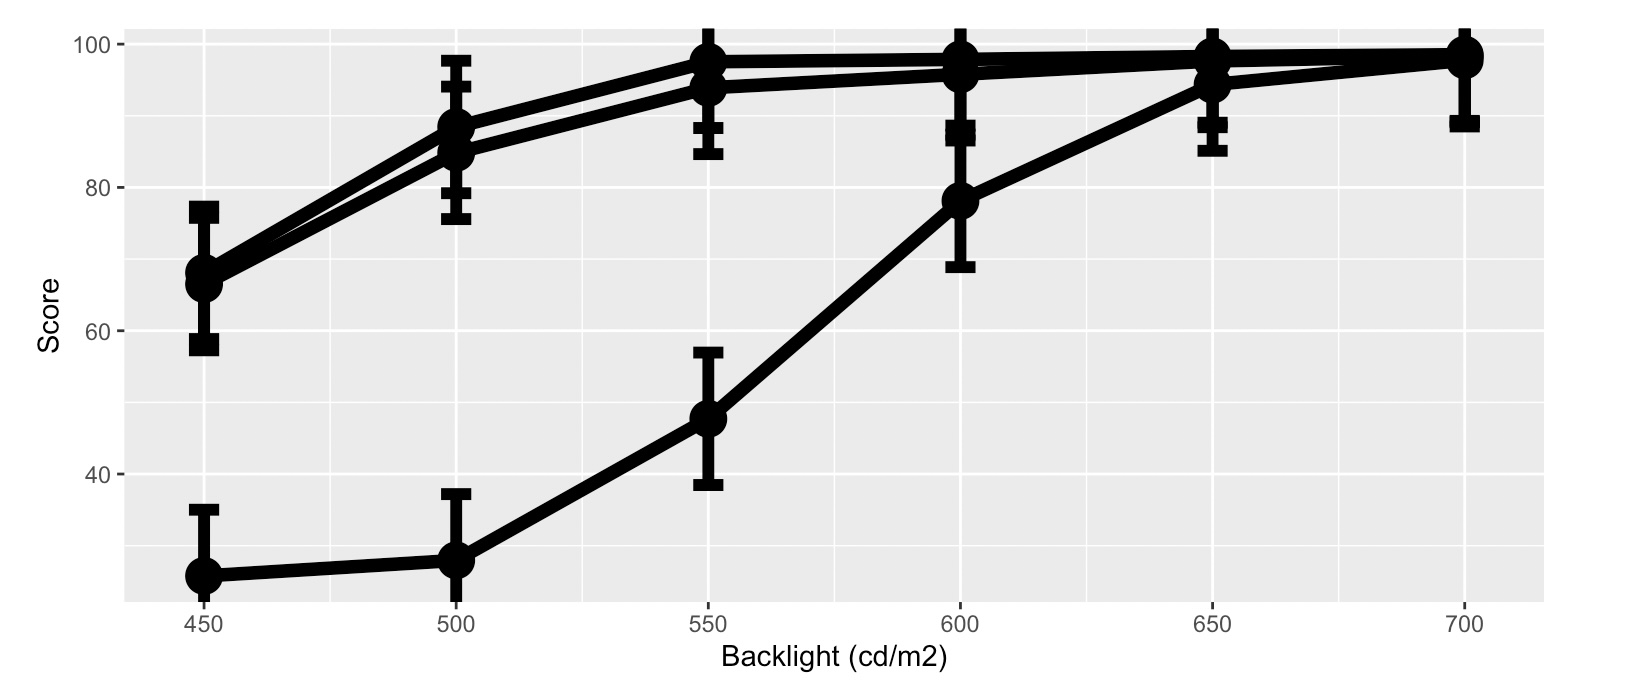
ggplot(BxTC, aes(x = Backlight, y = Mean, group = TargetColor)) +
geom_line(show.legend = FALSE, size = 2.4, color = "black", fill = TargetColor) +
geom_point(show.legend = FALSE, size = 6, color = "black", fill = TargetColor) +
geom_errorbar(show.legend = FALSE, ymin = Mean - FLSD, ymax = Mean + FLSD, width = 6, size = 2.1) +
scale_color_manual(values = c("WxRED" = "firebrick1", "WxGREEN" = "green3", "WxYELLOW" = "gold")) +
scale_x_continuous(breaks = seq(450, 750, 50)) +
scale_y_continuous(breaks = seq(20, 120, 20)) +
xlab("Backlight (cd/m2)") +
ylab("Score")
PS - Putting 'exists("TargetColor")'before the ggplot call produces no output. I still get the "not found" error, but neither TRUE nor FALSE appear before it.
In these lines, fill = TargetColor is outside of an aes() call, so for ggplot you seem to be refering to an object called TargetColor. Only aes() will search in the columns of the data frame, so you should rather write:
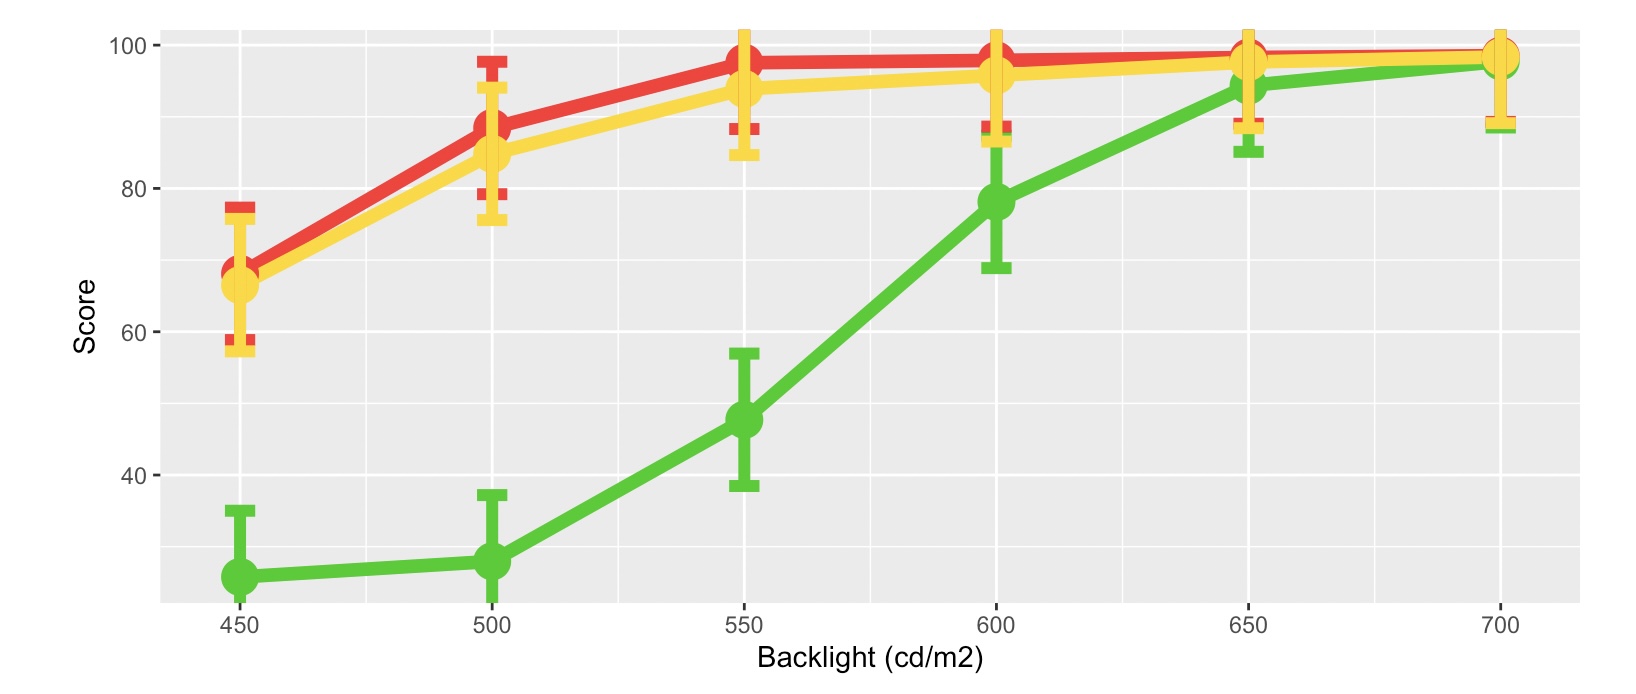
ggplot(BxTC, aes(x = Backlight, y = Mean, group = TargetColor, fill = TargetColor)) +
geom_line(show.legend = FALSE, size = 2.4, color = "black") +
geom_point(show.legend = FALSE, size = 6, color = "black") +
...
Also in that case, the presence of fill will automatically group by TargetColor, so you can just use:
ggplot(BxTC, aes(x = Backlight, y = Mean, fill = TargetColor)) +
geom_line(show.legend = FALSE, size = 2.4, color = "black") +
geom_point(show.legend = FALSE, size = 6, color = "black") +
...
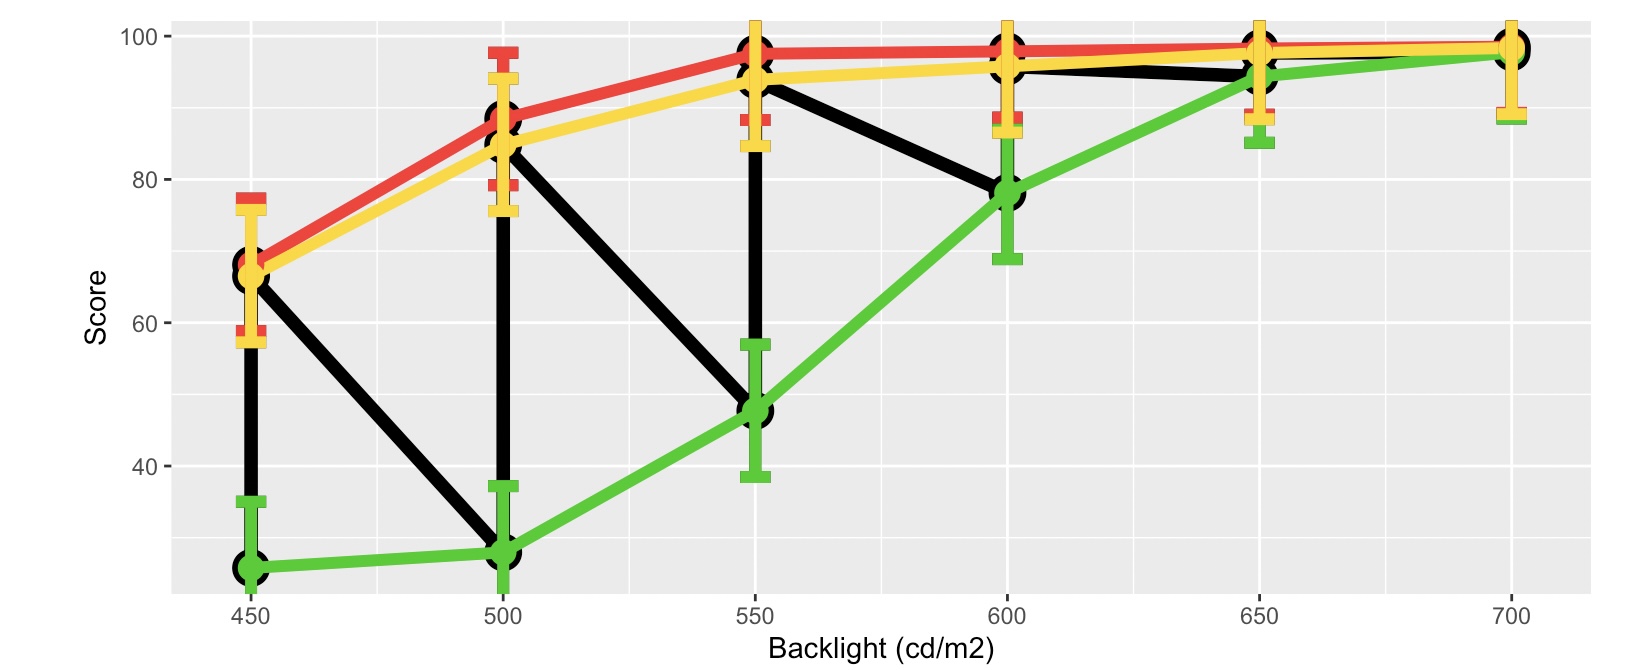
This is interesting. I've been thinking of variable and column names as equivalents (although there will be variables that aren't column names). I tried this:
This overlapping approach seems to work for the points and lines (although the black lines don't respect the group statement). Don't know why the black error bars don't appear.
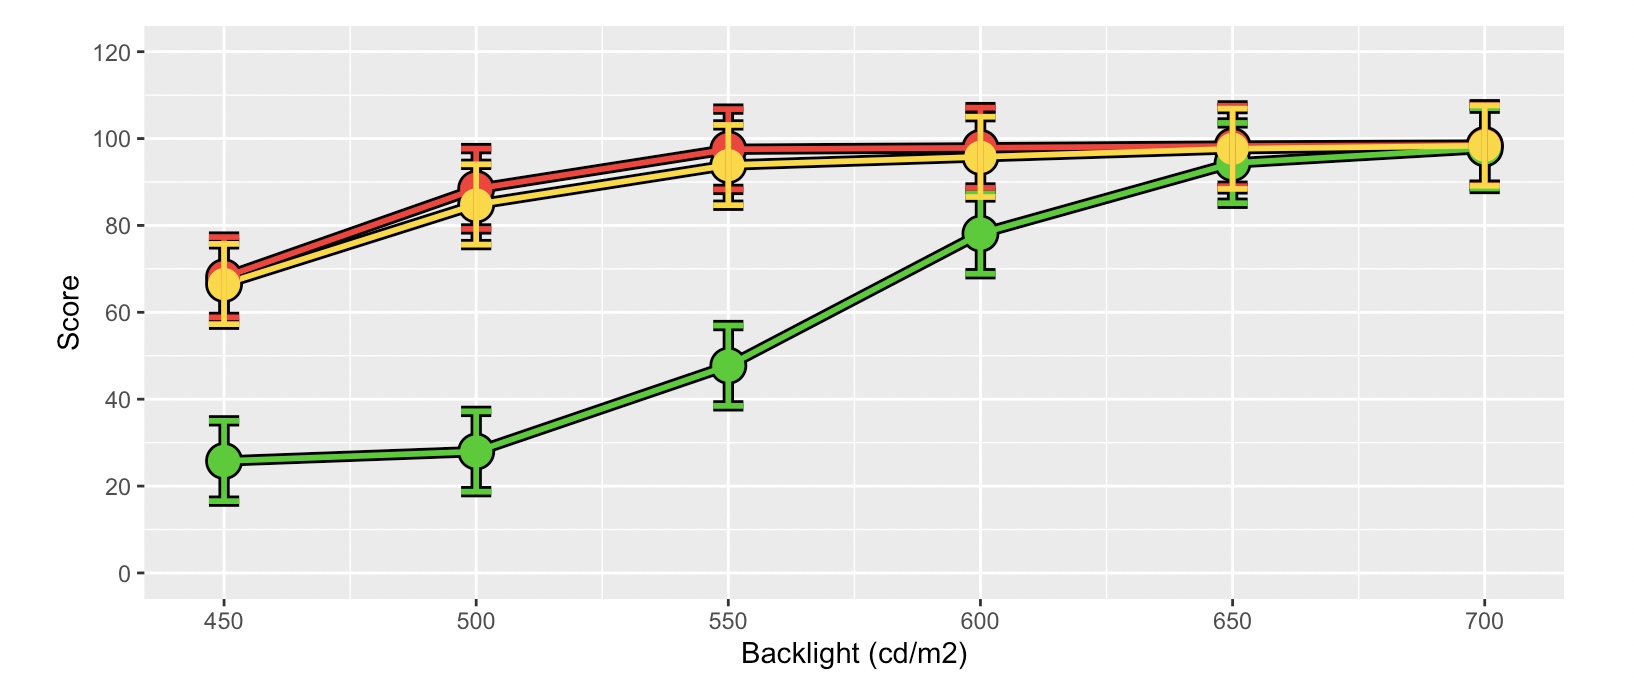
Not sure that's the problem (as FJCC mentioned, it'll be easier to answer with actual data to look at), but I would strongly recommend putting any variable aesthetics inside an aes() call:
geom_errorbar(aes(ymin = Mean - FLSD, ymax = Mean + FLSD),
              show.legend = FALSE, width = 6, size = 2.1, color = "black") +
Thanks to both of you for this tutorial. You've improved my understanding of how aes statements work, which is more than I asked about initially. I flipped a coin to choose the Solution because you both contributed equally.