I was trying to use something like
scale_x_date(date_breaks = "3 months",
             date_labels = "%Y %m")
To label my quarterly data in ggplot. But my dates are Jan, Apr, July, Oct. I can't really tell what ggplot is using as the origin. Is there a way to pick to origin with scale_x_date ?
Here's my example:
library(tidyverse)

df <- tibble(
  mydates = seq(as.Date("2017/1/1"), by = "quarter", length.out = 9),
  myvalue = rnorm(9)
)

df
#> # A tibble: 9 x 2
#>   mydates    myvalue
#>   <date>       <dbl>
#> 1 2017-01-01   0.844
#> 2 2017-04-01   0.526
#> 3 2017-07-01   0.570
#> 4 2017-10-01  -0.566
#> 5 2018-01-01   1.16
#> 6 2018-04-01  -1.54
#> 7 2018-07-01   0.828
#> 8 2018-10-01   2.10
#> 9 2019-01-01  -0.376

ggplot(df ) +
  aes(x = mydates, y = myvalue) +
  geom_line(size = 1L, colour = "#0c4c8a") +
  theme(axis.text.x = element_text(angle = 90, vjust = 0.5)) +
  theme(strip.text.y = element_text(angle = 0))  +
  scale_x_date(date_breaks = "3 months",
               date_labels = "%Y %m")

Created on 2019-11-04 by the reprex package (v0.3.0)
so you can see that even though my data is in months 1,4,7,10 the resulting plot is in months 2, 5, 8, 11. My solution has been to convert the dates to factors or strings and plot accordingly. Which gets the job done, but it feels like I should be able to do this with date functions.
I even resorted to RTFM (gasp) to no avail.
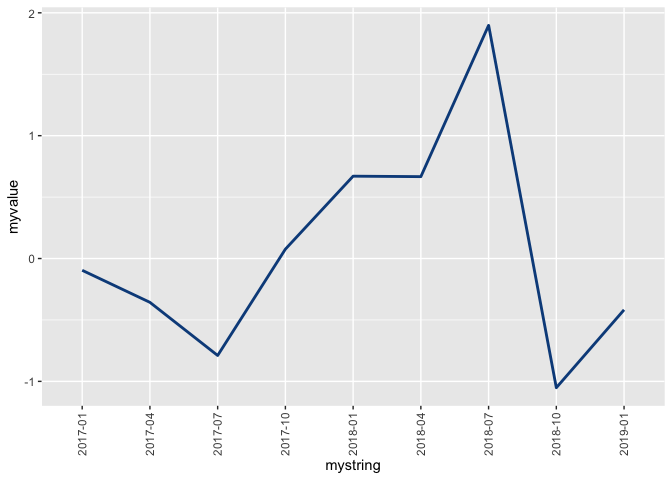
String Work Around
For future travelers who land here, this was my solution to work around this by converting the dates to strings. Note that I have to insert group = 1 in the aes and also set the breaks and the labels explicitly.
library(tidyverse)

df <-
  tibble(mydates = seq(as.Date("2017/1/1"), by = "quarter", length.out = 9),
         myvalue = rnorm(9))

df %>%
  mutate(mystring = as.character(mydates, format = "%Y-%m")) ->
  df

df
#> # A tibble: 9 x 3
#>   mydates    myvalue mystring
#>   <date>       <dbl> <chr>
#> 1 2017-01-01 -0.0958 2017-01
#> 2 2017-04-01 -0.357  2017-04
#> 3 2017-07-01 -0.789  2017-07
#> 4 2017-10-01  0.0763 2017-10
#> 5 2018-01-01  0.670  2018-01
#> 6 2018-04-01  0.667  2018-04
#> 7 2018-07-01  1.90   2018-07
#> 8 2018-10-01 -1.05   2018-10
#> 9 2019-01-01 -0.418  2019-01

ggplot(df) +
  aes(x = mystring, y = myvalue, group = 1) +
  geom_line(size = 1L, colour = "#0c4c8a") +
  theme(axis.text.x = element_text(angle = 90, vjust = 0.5)) +
  theme(strip.text.y = element_text(angle = 0)) +
  scale_x_discrete(breaks = c(df$mystring),
                   labels = c(df$mystring))
Created on 2019-11-04 by the reprex package (v0.3.0)